Executing JavaScript in Safari Weirdly Slow on Big Sur

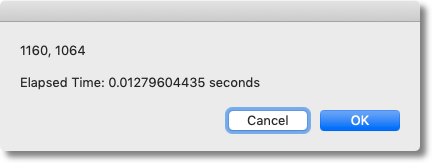
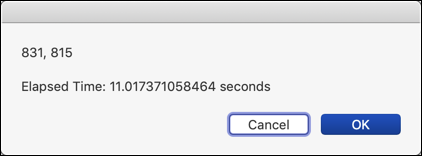
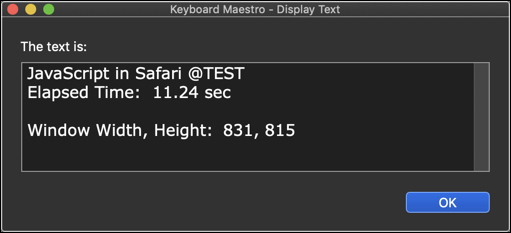
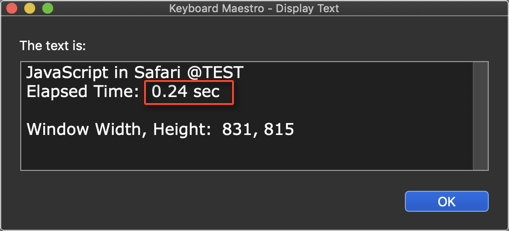
I have a short macro, that tells me the current size of the current Safari window in a notification. It worked like a charm for quite some time, but some weeks ago, it did not work at all – at least I thought that. Today I tested it again, tried the debug window, but that did not tell me much, but I realised that the macro was indeed working, it just takes a very long time, and I have no idea why. The script is not complicated or long, but it now takes about 15-20 Seconds until the notification appears and I can hear the fans of the MacBook Pro spin up.

Does anyone have a clue? Did Apple change something in one of their latest updates?
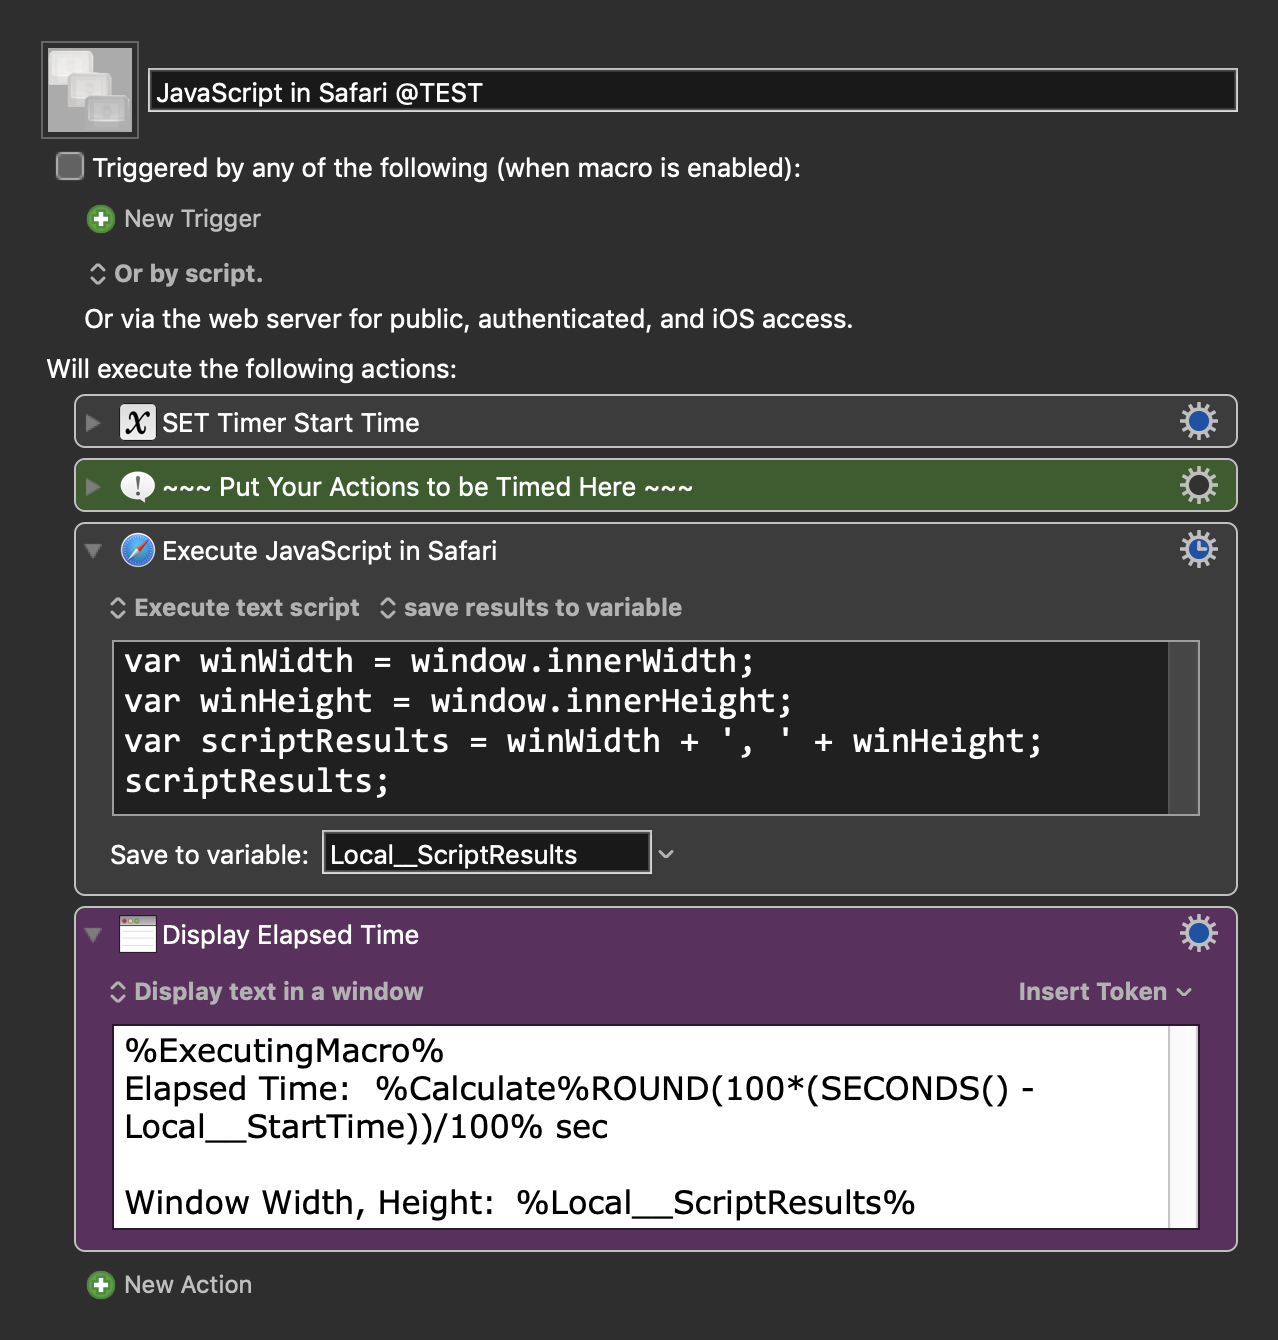
Here's the macro:

Execute JavaScript in Safari
window.innerWidth

  • Save trimmed results to variable “safari_viewport_width”.
    (Stop macro and notify on failure.)

Execute JavaScript in Safari
window.innerHeight

  • Save trimmed results without errors to variable “safari_viewport_height”.
    (Stop macro and notify on failure.)

Display Text Briefly
%Variable%safari_viewport_width% × %Variable%safari_viewport_height%

Hey Fabian,

This is definitely peculiar.

Unfortunately you haven't provided enough information to help diagnose the problem.

  • What version of macOS?
  • What version of Keyboard Maestro?
  • What hardware?
  • Have you quit and restarted the Keyboard Maestro Engine?
  • Have you quit and restarted the Keyboard Maestro Editor?
  • Have you rebooted?
  • Have you looked through the troubleshooting section of the wiki?

Please post the macro itself, so people can actually test your work without having to jump through hoops.

How to Post Your Macro to the Forum

-Chris

1 Like

Right you are.

This is the marco:
Safari- What Size?.kmmacros (3.1 KB)

  • macOS Big Sur v11.3.1
  • Keyboard Maestro v9.2
  • MacBook Pro (15-inch, 2017)
  • I have quit KM several times, Engine and/or Editor.
  • I have rebooted (Mac was off for the night).
  • I have unset and reset the accessibility rights in System Prefs > Security & Privacy > Accessibility as well as in … > Input Monitoring.
    I could not unset the accessibility rights at first so I completely removed the apps from this pane and waited for KM to request the rights after another reboot. This seems to have fixed some typed string triggers that did not fire before (like your Macro to get the macOS version ;-).
  • I went through the interactive help guide, which led me back here at the end. The macro does not have any triggers, because it's launched from a palette.
  • The macro is working, but it's still taking the above mentioned unusual amount of time.

What I realised when looking around in Safari, is that activating and deactivating extensions takes a very long time, too (spinning beachball included)

I also tested the Macro on my MacBook Air M1 and it ran as expected, so it seems to have something to do with my old work machine. Therefore I don't expect any solutions from you anymore, except maybe some hints for trouble shooting or experiences like "when I had something like this, resetting the PRAM worked" …

I can confirm this behavior, an excessive amount of time to execute JavaScript in Safari,

  • on my 2019 iMac-27 512GB SSD, 3.6Ghz i9 CPU, 40GB RAM,
  • running Safari 14.0.3 (14610.4.3.1.7) on macOS 10.14.6 (Mojave).

image

So I am running a fairly recent (2019) iMac, but with macOS Mojave, and I am seeing the same behavior. This makes me suspect Safari. Maybe Safari behaves differently with the new Macs with M1. Just a guess since I don't have a Mac like that to test.

EDIT: 2021-05-19 15:37 GMT-5

I ran the same test in Chrome, and it was very fast:

image

Here's my test macro:

~~~~~~~~~~~~~~~~~~~~~~~~~~~~~~~~~~~~~~~~~~~~~~~~~~~~~~~~~~~~~~~~~~~~

MACRO:   JavaScript in Safari @TEST

-~~~ VER: 1.0    2021-05-19 ~~~
Requires: KM 8.2.4+   macOS 10.11 (El Capitan)+
(Macro was written & tested using KM 9.0+ on macOS 10.14.5 (Mojave))

DOWNLOAD Macro File:

JavaScript in Safari @TEST.kmmacros
Note: This Macro was uploaded in a DISABLED state. You must enable before it can be triggered.


1 Like

Hmm...

I get pretty much what I'd expect with Safari 12.1.2 on macOS 10.12.6:

JavaScript in Safari @TEST
Elapsed Time:  0.26 sec

Window Width, Height:	1314, 1085

For posterity:

  • How much memory do you have on that machine?
  • How many extensions do you have loaded?

https://developer.apple.com/forums/thread/666529

This looks like another case of Bad Apple!

Just for corroboration you might run this AppleScript in the Apple Script Editor.app with Safari already running:

--------------------------------------------------------
# Auth: Christopher Stone
# dCre: 2021/05/19 21:45
# dMod: 2021/05/19 21:45 
# Appl: Safari
# Task: Get innerWidth & innerHeight of front window with elapsed time.
# Libs: None
# Osax: None
# Tags: @ccstone, @Applescript, @Script, @ASObjC, @JavaScript
--------------------------------------------------------
use AppleScript version "2.4" --» Yosemite or later
use framework "Foundation"
use scripting additions
--------------------------------------------------------
property LF : linefeed
--------------------------------------------------------

set startTimer to current application's NSDate's |date|()

set jsCmdStr to "

var winWidth = window.innerWidth;
var winHeight = window.innerHeight;
var scriptResults = winWidth + ', ' + winHeight;
scriptResults;

"

set jsResult to doJavaScriptInSafari(jsCmdStr)

set endTimer to -(startTimer's timeIntervalSinceNow())

set outputStr to jsResult & LF & LF & "Elapsed Time: " & endTimer & " seconds"

display dialog outputStr

--------------------------------------------------------
--» HANDLERS
--------------------------------------------------------
on doJavaScriptInSafari(jsCmdStr)
   try
      tell application "Safari" to do JavaScript jsCmdStr in front document
   on error errMsg
      error "Error in handler doJavaScriptInSafari()" & return & return & errMsg
   end try
end doJavaScriptInSafari
--------------------------------------------------------

-Chris

I don't think so.
I'm running macOS 10.14.6 (Mojave) and JS in Safari is slow for me, as I clearly showed above.

I also have lots of RAM: 40GB, so that's not the issue.
I have almost no extensions in Safari.

So it is something else.

Just another data point from Mojave 10.14.6 on an unsupported Mid-2010 MacBook Pro with 8-GB RAM and Safari 14.1:

ss-987

Thanks for all your unexpected input and work!

The MacBook Pro has 16 GB RAM
I don't have many extensions active at a time. Usually only 1Password, Fixerrific, and Downie.

I also found the thread you linked to, but it's not exactly what I'm experiencing. Safari itself is not slow in my daily work.

I ran @JMichaelTX's Script, just to be sure.

JavaScript in Safari @TEST
Elapsed Time: 10.28 sec

Window Width, Height: 1024, 792

Your Applescript showed these results:

1024, 792

Elapsed Time: 10,016112089157 seconds

So all pretty much the same.

I ran the same script adapted to Chrome:

JavaScript in Chrome @TEST
Elapsed Time: 0.27 sec

Window Width, Height: 1024, 821

Entering the script in Safari's console delivers the result instantly.

It's only the JavaScript from Applescript that seems to be very slow.

So either there's a security feature (or bug) in Safari on Big Sur on Intel Macs or, and that's what I think is most probable at this point, I have messed up my Safari somehow.

I'm most suspicious of the Safari Extensions at this point, because that pane is also incredibly slow, often just by hovering over the short list of extensions, the beachball appears.

Anyone have any idea how to clean up this without uninstalling a bunch of essential apps?

(I also reset my PRAM, but that did not change anything.)

Edit: I installed the Safari Technology Preview and ran ccstone's script adapted: 1,414 seconds. Another hint that the normal Safari is the culprit.

See https://discussions.apple.com/thread/252111914 for a couple of approaches to the Big Sur/Safari slowdown.

I get the same results running Safari 14.0.3 (14610.4.3.1.7) on macOS 10.14.6 (Mojave), running the AppleScript from SD7.

image

KM Test

image

Two important points:

  1. I am running ==Mojave==
  2. I am running ==Safari 14.0.3==

I will see if I can update to Safari 14.1.

@fab1An:

I did upgrade to Safari 14.1, but that did NOT fix the problem.

But I did discover the cause of the Safari slowdown on Mojave:

AFTER unchecking "Automatically Show Web Inspector...", JS in Safari runs fast:

image

Running Safari 14.1 (14611.1.21.161.7) on macOS 10.14.6 (Mojave).

2 Likes

Hey Fabian,

I'd try this first:

Safari > Preference > Advanced

If emptying the caches doesn't help, and I was feeling stubborn I'd create a clean new user and test Safari there.

-Chris

I have reason to suspect MacOS BigSur as at least part of the cause of the problem decribed by fab1An.

I have experienced the same issue with JavaScript running under MacOS Big Sur 11.6 (20G165) on a 2020 MacBook Air with 16 gb of Ram. My JavaScript is executing in pdf forms in the Adobe Acrobat DC environment. Prior to upgrading that computer to Big Sur from MacOS Catalina I did not have this problem. Also, the same pdf form functions very well on my 2013 iMac running MacOS Catalina 10.15.7.

On the MacBook running BigSur you can see the data changing as the scripts execute: the data refreshed in the rows and columns of the form fields, as if watching window blinds lowering one window at a time in a row of windows. By contrast, pdf files that are not scripted run very well on the same computer. I can navigate through the nearly 800 page API Reference rapidly.

I have removed Acrobat DC from the Big Sur Mac using the cleaner app and then reinstalled DC with zero change in functionality. The more scripts in files tested, the worse the performance. I've considered downgrading from Big Sur to Catalina, but that requires wiping the MacBook and reinstalling the OS and programs, a major inconvenience. If anyone else has evidence of Big Sur adversely affecting the execution of JavaScript in any environment please post about it.

  • ODuinn

Safari JavaScript can be slowed down by switching on JSContext debugger mode.

If you have a Develop item in your menu, the 3rd menu item will be the name of your device.

Under that item, ensure that you have unchecked:

Automatically Show Web Inspector for JSContexts

Screenshot 2021-10-15 at 09.49.30

5 Likes

Thank you, Sir! Unchecking this setting seems to have solved my issue. D'oh!

1 Like