Ok, I will consider that. Truth is, I never even noticed the link bar under each post, until now. I presume that's how you get post-centric links. I'll try harder but it won't be instant.
1 Like
Yes, but you can select a post via a keyboard shortcut ( j or k ) and then use a JavaScript to grab the post-specific URL.
So the process can be automated to a reasonable degree.
Execute a JavaScript in Safari.kmactions (714 B)
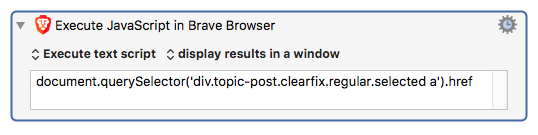
document.querySelector('div.topic-post.clearfix.regular.selected a').href
** NOTE – After selecting a post with the keyboard you must pause a beat to let the page code catch up, before you activate your macro. Otherwise you'll likely get the post that was selected before the one you want to link to.
-Chris
Tags: »Discourse, »Post, »URL, »JavaScript
1 Like
I just tested the button that looks like a chain link under my post. It seems to work fine. I don't think I'll need to create a macro to do that since the link works perfectly fine, but thanks. I have never had much success learning Java or Javascript or anything that starts with a J.
Sounds like it is related to reloading the macros.
With all the macros disabled, find your Keyboard Maestro Macros.plist file (in ~/Library/Application Support/Keyboard Maestro), zip it up and send it to me (support@stairways.com) (you might have to use some sort service to send the file if it is 20MB).
Then I can see if maybe I can duplicate the issue with your macro file.
1 Like
All I ever do is point to the page, and I presume that the reader can scroll down to find the text I'm quoting. I don't think I'll ever change from that behaviour. I post to web pages in their entirely, not links to things halfway down pages.
Ahh ok, now I understand ![]()
The reason for the confusion is that you actually did not point to the page.
For example your first link from here:
https://forum.keyboardmaestro.com/t/slider-support-to-display-and-modify-variables/9630/5
See that /5 at the end of your link? That means post #5 of the thread, and because of that your link does not point to the page – as you thought – but to exactly that post #5.
And post #5 is @mrpasini’s post, and that’s why he has chimed in and said it hasn’t anything to do with the current issue.
In order to link to the thread (aka topic, the “page”), you’d have to omit that last number (/5) in the link.
You can get the thread link (without any final post number) by right-clicking the thread title (not any post) and selecting “copy link” from the contextual menu.
So, to sum it up:
- post link: chain icon at the bottom of the post
- topic (thread) link: topic title
Already tried the safe mode boot?
1 Like
Oh? I'm sorry. I just copied and pasted from the address bar. I assumed that that would bering other people to the same page I was viewing. But I have seen websites in the past where the address bar doesn't match the page being displayed. I don't know how that's possible. I guess I really have to use that link button now.
I'll have to google how to run safe mode in macOS, but I'll do that now. I've done it a few times before but I need to google it right now.
Most certainly you landed on that page via another post link. But obviously at that time you didn't know about the existence of post links, hence you thought it was a topic (page) link.
So, you actually had a post address in your browser's address bar – not the page address.
No need to do that. Just click on the link I gave to you in my post. It goes directly to the article on Apple's support pages. The article is very good, and you should read it. It also explains how to do it.
Here again the link:
I read that Apple page about booting into safe mode. I tried twice. Each time I waited 15 minutes. The progress bar got stuck near 100% and never reached the login screen. I don't think it should take that long.
Let me know if you think I should reinstall macOS to get that to work.
That's a very generous offer, Peter.
I should say that I am using KM to build a prototype of a product I want to rewrite in xCode for iOS once I understand xCode well enough to do that. As a result I would have to delete my macros that relate to the product before I send you a copy.
It's just a business precaution. I have always found you to be reliable, generous and trustworthy. But it seems prudent at this juncture. It's such a great program I've developed. It's more because I'm paranoid than anything else.
And I'm also trying to reboot in safe mode right now, which as you can see, isn't happening. That too is causing me a delay here.
15 minutes is a bit long, but not out of this world. As the Apple article says, when safe-booting the system verifies the start volume and does a file-system check, and repairs as necessary. This can take some time.
I would try it again and wait something like 40 to 60 minutes before interrupting the boot.
If this fails too, then there is probably some non-trivial issue with your system or start volume, which might require a reinstall or a re-partitioning.
PS:
You really should do it when you have time. It’s not something you do while preparing coffee. Not only because of the longer boot time, but also because once in safe mode it usually takes some time to definitely tell if the issue has gone away or not:
Unless it happens that you can reproduce your memory issue on the first attempt, you’ll have to try different scenarios to reproduce it. Only then you can really say, it has gone away.
I went out for an hour for dinner and when I came back it was in Safe mode. I correctly verified it was in Safe mode. Now for some testing.
Great. So, I wasn’t too far off with my “40 to 60 minutes” 
have been testing for only twenty minutes but here are my preliminary results.
-
clicking on Enable/Disable group repeatedly does not make the Engine lose memory, at least not continually. It temporarily lost up to 20 MB from the baseline of 44 MB but that seems normal.
-
enabling all my other macro groups caused the Engine to accelerate up to 900 MB but then fairly quickly dropped back down to 185 MB. I'm not sure if this is normal behavior or not.
-
The KM Debugger rarely responds to my commands. It opened. 99% of the time when I click on something, like "Pause New Macros" it does nothing. It doesn't even close when I click on the (X). The icon in the upper right corner of the screen isn't responding to any clicks. At the start it seemed to be working but became unresponsive over time and is now frozen. There is one macro that appears to be "running" in the window and it's stuck on an innocuous "Speak Text" action. I would like to note that in Safe Mode the speakers are completely unavailable and I'm wondering if the Speak Text action is failing for that reason, causing the entire Engine to hang up. In the Activity Monitor the Engine is showing absolutely no change in memory (185.2 MB) or CPU usage (0%). The process is clearly hung. It does not say "not responding" however. So I will restart the Engine. I've restarted it. I opened the debugger. So far it's working. But there you go, it's refusing to process the Speak Text action again. It's not hung yet. But clearly in Safe Mode the Speak Text action is causing the debugger to freeze that action, while allowing other actions to continue. This could be normal for the KM Engine. I.e., without audio output drivers, the Engine may hang on audio statements. Aha! When I try to terminate one of the hung actions, the KM Engine totally hangs up. Now it even says "not responding" in the activity monitor., I restarted the Engine and repeated this. The engine always freeze and becomes unresponsive whenever I try to terminate a Speak Text action, which it can never execute.
I guess I can't accurately test the KM Engine until I remove all the Speak Text actions from my macros, which I use as debug statements. That will take a little time.
In the future I plan to create stubs for all actions in KM so that when I need to disable or modify it in some way, I have to edit only one location rather than hundreds.
OK, not what I was hoping to see. I hoped you could reproduce the issue, so that we could exclude that there are any third-party factors involved. Well, I hoped, but I did not expect to see it ![]()
With 20 minutes it was obviously not a complete test (see my PS), but I understand that with the Speak-action problems it might be difficult to continue.
However, your test already seems to point into one direction:
clicking on Enable/Disable group repeatedly does not make the Engine lose memory, at least not continually. It temporarily lost up to 20 MB from the baseline of 44 MB but that seems normal.
Assuming that in normal mode (not safe mode) the issue is clearly reproducible by enabling/disabling groups, it means there is indeed some interdependency with other processes or with some aspects of your normal system setup that triggers the memory leak.
enabling all my other macro groups caused the Engine to accelerate up to 900 MB but then fairly quickly dropped back down to 185 MB. I'm not sure if this is normal behavior or not.
I don’t know either if this is normal, but I would not call it alerting. If memory consumption spikes up for a short time and then drops back to something normal (like the 185MB) I would not speak of a leak in any way.
The KM Debugger rarely responds to my commands.
Do you have to use the debugger? (Did it trigger memory leaks in normal mode?)
I would like to note that in Safe Mode the speakers are completely unavailable
In safe mode all third-party kernel extensions, and probably also any other third-party “drivers”, are disabled. If you are using third-party drivers for your audio normally, then this would explain it.
I guess I can't accurately test the KM Engine until I remove all the Speak Text actions from my macros, which I use as debug statements.
If I recall correctly, you are on an iMac, no? Couldn’t you just switch the system’s audio output to the normal speakers, so that the Speak actions work also without any third-party stuff?
Now you have two possible ways to continue:
-
You take the results of your 20-minutes test as serious. That means, continuing your bug hunt under the assumption that a third-party factor is the trigger for the leak.
- Of course, this makes the whole thing tedious, because isolating the responsible factor out of a few dozens of potential factors is not fun.
-
You try to solve the audio complications (either by eliminating the Speak actions or by making your audio work without third-party drivers), and continue with another extensive safe-mode test, hoping that you can reliably reproduce the memory issue also in safe mode.
- This would be kind of a prove that the bug is a KM-“standalone” bug. Less work for you, more work for @peternlewis

- This would be kind of a prove that the bug is a KM-“standalone” bug. Less work for you, more work for @peternlewis
BTW, it seems a bit odd to me that the absence of audio drivers produces such heavy issues (“Speak Text action is failing […] causing the entire Engine to hang up”). Maybe you should tell us more about your audio setup…
I had never considered that the debugger may be the cause of leaks in Normal Mode. That idea never entered my mind. I use the debugger frequently to debug. I'll have to pay more attention to that idea.
The speakers don't show up in the list (System Preferences, Sound, Output) when I'm in Safe Mode. The Apple TV does show up, along with what appears to be my HomePod speaker. The Apple TV is selected by default. I get an error after ten seconds when I try to connect to the HomePod but it still selects it.
So I'm not sure what you want me to do here.
I don't have any audio setup. All I have is the internal iMac speakers which disappeared when I booted in Safe Mode. As I said above, the Apple TV shows up as an audio option (it is selected in Safe Mode) and the HomePod appears to be there under the name "Dining Room" which likely means my HomePod.
I am pondering your two options for further investigation.
OK. A bit surprising that the iMac’s native audio software is disabled in safe mode. I have to check out on next occasion, if something similar happens with my MBP in safe mode.
So, personally I would go with Option 1 (taking the results of your 20-minutes safe-mode test as serious) and start to hunt for the culprit.
But I will not recommend this to you, because if after 5 days of trying to isolate the culprit you do another safe-mode test, and this time it turns out that you can reproduce the issue in safe mode, then… you will certainly kill me ![]()
However, if I recommend you to disable hundreds of Speak actions and continue the safe-mode test, and then it turns out that your 20-minutes test was right (= you cannot reproduce the issue in safe mode), then you will kill me also ![]()
PS:
Have you already tried out if the issue is still present in normal mode now?
(I’m asking because a safe boot also clears many caches, which can also be a factor.)
It's been only 20 minutes and I think I've replicated the problem in Safe Mode. I'm just creating a few macros as stubs to make my life easier in the future. And the memory is fast rising at a rate of about MB per second. It's up to 500 MB now. Here's an example of a stub macro:
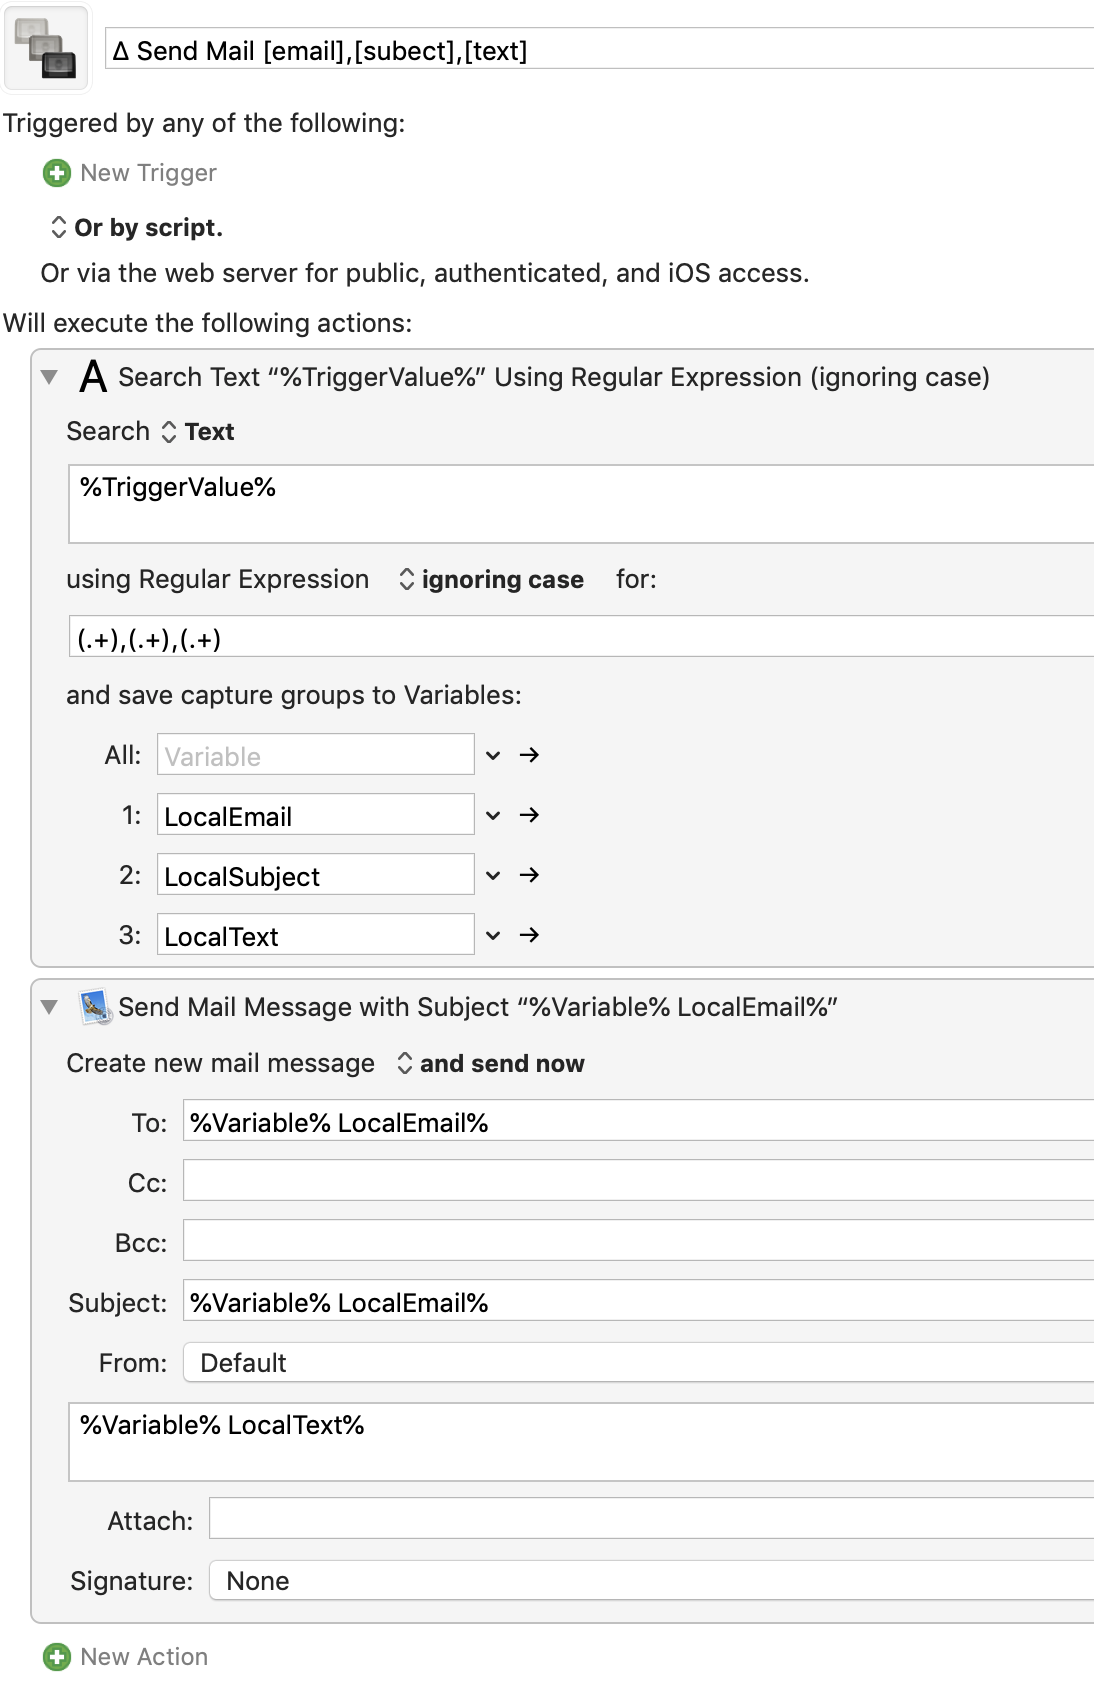
For the most part I haven't even tested any of my stubs yet. The memory leak is just caused by using the KM Editor in Safe mode.
I'll continue to test but that's how it's looking at the moment. Once it hits a couple of Gig of RAM I'll repot back.
If you see any typos in my email that's because in Safe Mode the OS cannot keep up with my typing. Not my fault.