I've been running and watching this for some days now, but so far it hasn't shed any light on the original problem. Although, the problem has only happened once since using this macro, and the macro didn't register it as low memory, which was odd.
This has been niggling at my brain. Because WindowServer's virtual memory usage is always sitting at (or near) 410 GB, so it doesn't seem to be a useful indicator in this case. And ps can only read its virtual memory and always reports 0.0 for %cpu and %mem, even though these values are reported in Activity Monitor (even btop and htop don't report any usage values for it). For whatever reason, the physical footprint seems to be an indicator for something, but as far as I could find ps can't return the physical footprint.
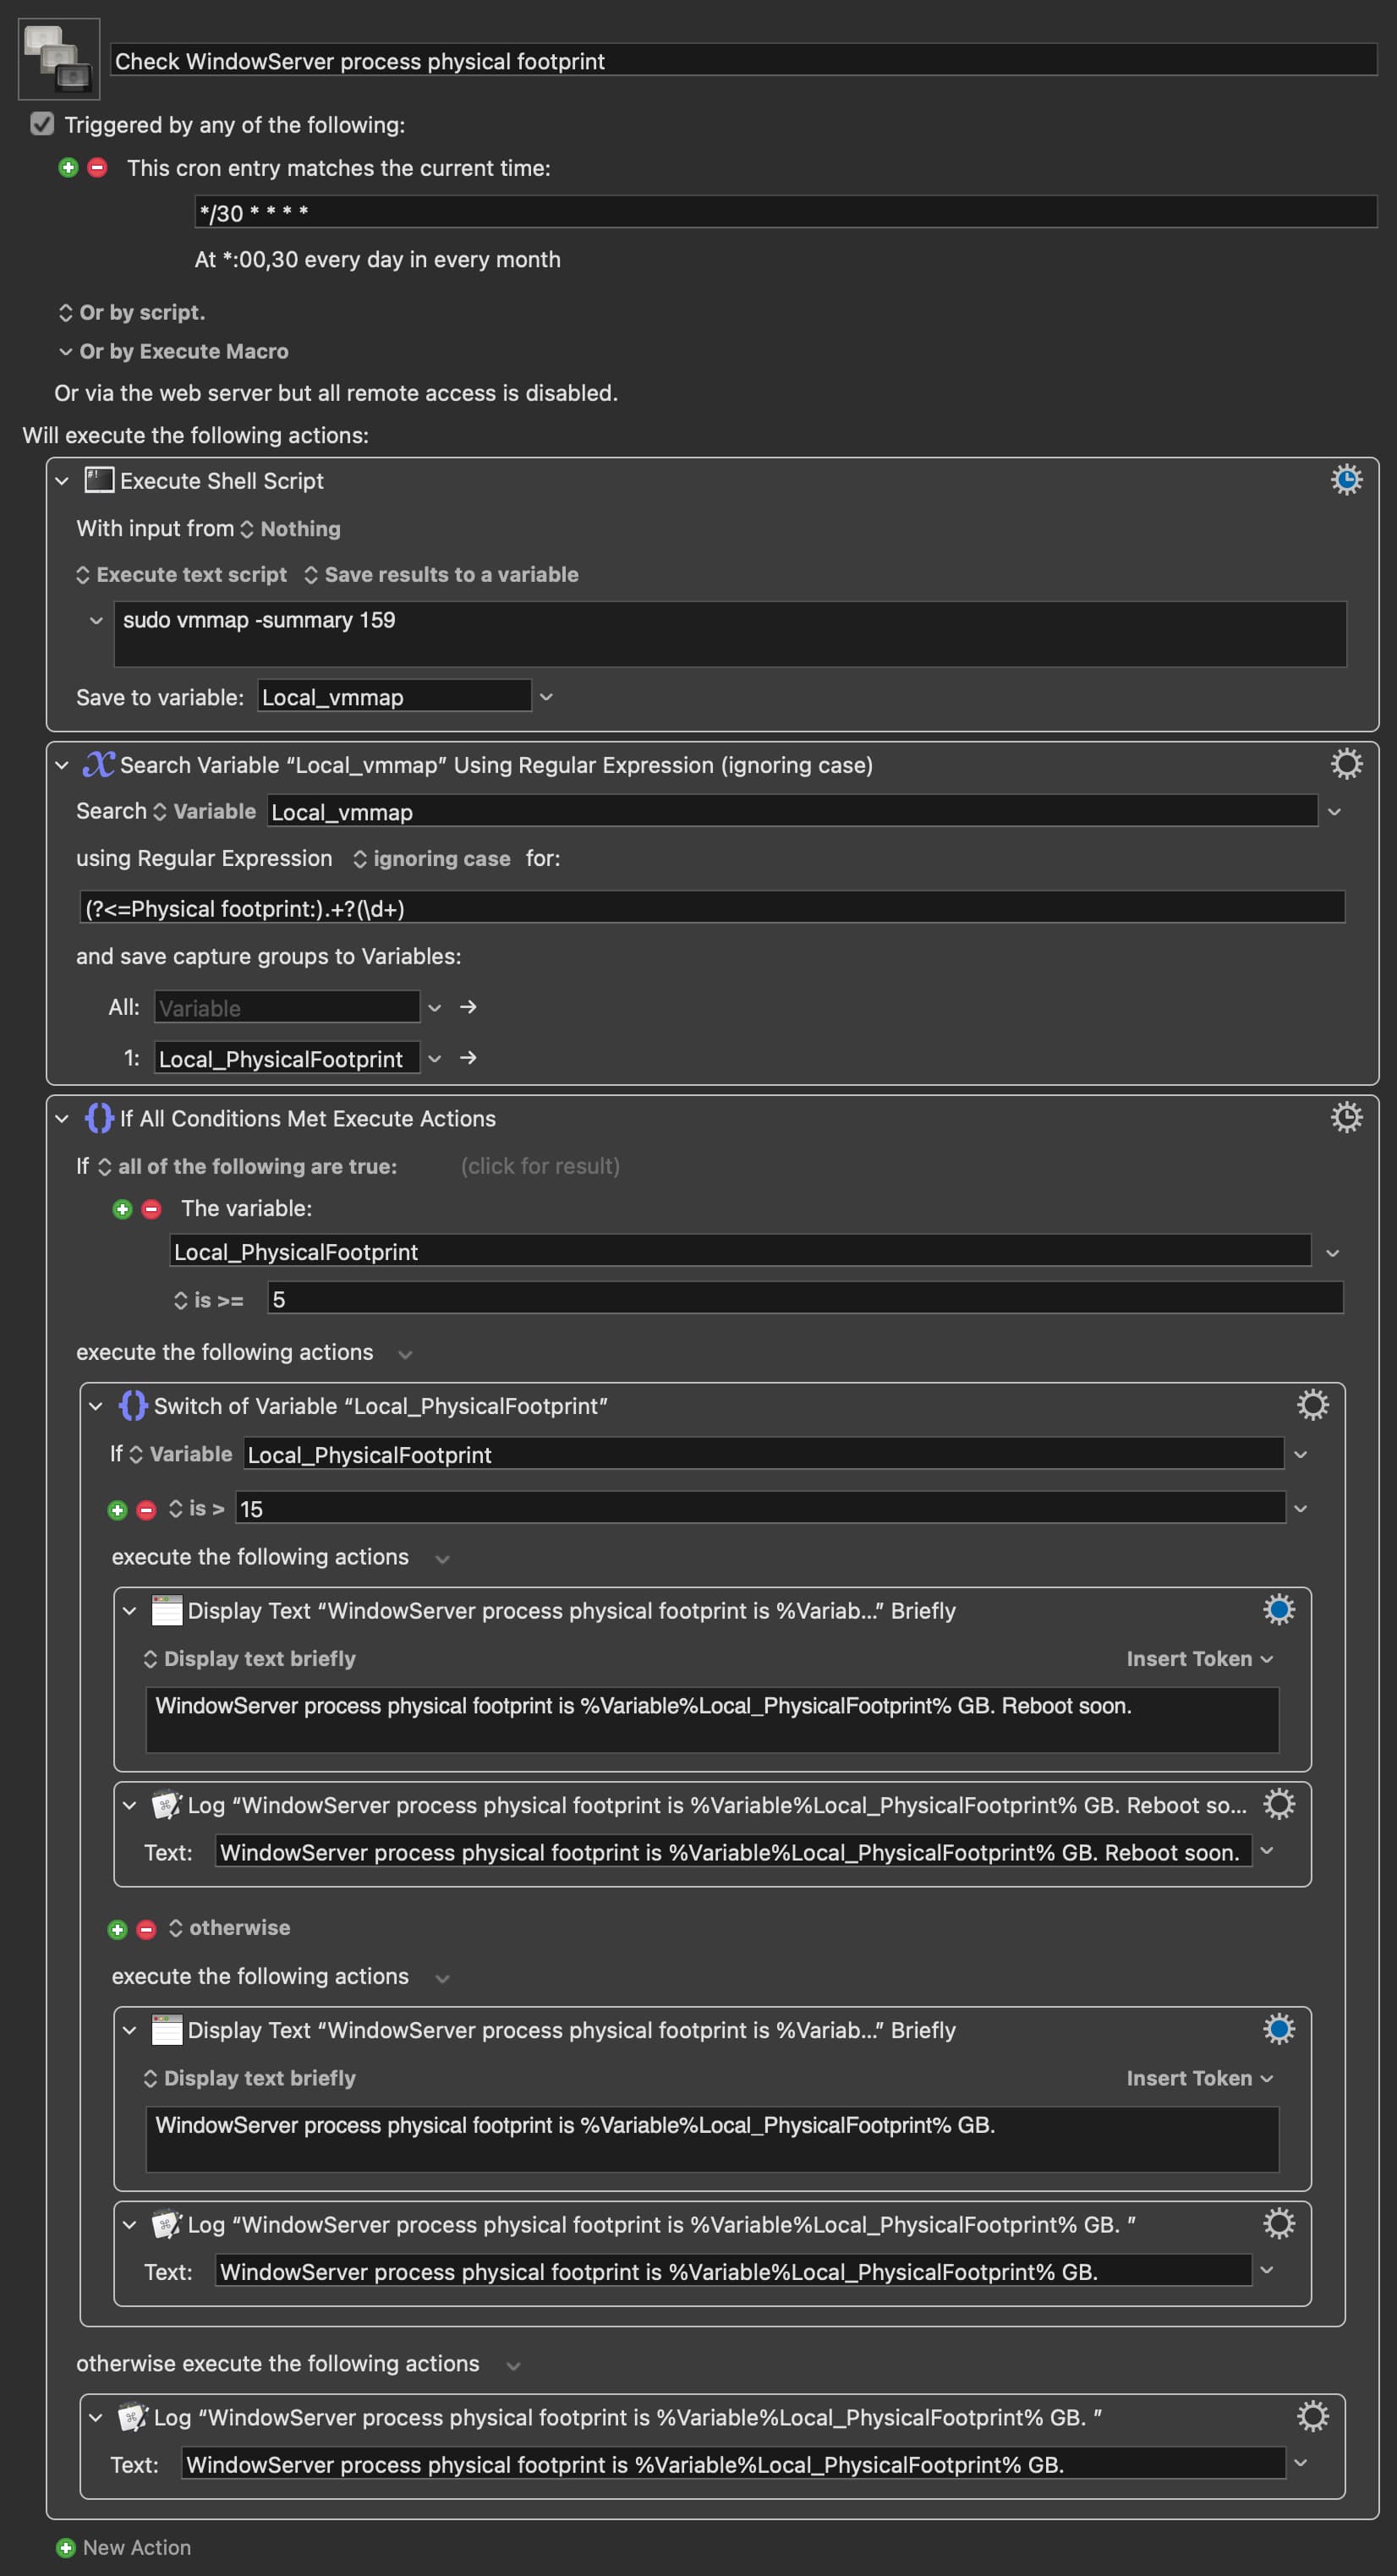
The memory pressure goes up, but then goes down again. The WindowServer process virtual memory stays functionally the same, but the physical footprint grows gradually and never comes back down. It turns out that vmmap reports the physical footprint, but it requires sudo to access the WindowServer process. Fortunately, this problem is already solved (by you, Nige_s) here (though of course using the path /usr/bin/vmmap in this case). I wrote this macro and have been running it in tandem(ish) with yours (very fortunately the WindowServer process seems to always have the same PID). However, I will note that the physical footprint has climbed over 16+GB as of this moment, and I haven't been experiencing any issues. So I guess I just have to keep watching for some while longer, although maybe (hopefully) whatever the problem was has resolved itself.