Uh, yeah, that was it...
Nope, just ignorance. Thanks, I'll do that in the future, assuming I remember to change it in the code I keep copying... ![]()
Uh, yeah, that was it...
Nope, just ignorance. Thanks, I'll do that in the future, assuming I remember to change it in the code I keep copying... ![]()
The AppleScript export facility grew out of communication of the macros with KeyCue, so it is compatible with that which is independent of most other things.
In AppleScript, you can get the name of the currently running script by:
name of me
I can’t seem to find the JXA equivalent. I’ve done extensive searching, and tried the following:
me.name
me.name()

var app = Application.currentApplication()
app.includeStandardAdditions = true

var nameStr = app.me.name()
var nameStr = app.me.name
Any solutions/ideas/suggestions?
Where ‘name of currently running script’ is intended to be a filename or a top level module name ?
(‘me’ incidentally is a piece of Applescript syntax, not bound in or relevant to JavaScript )
From The AppleScript Language Guide: The it and me Keywords
The it and me Keywords
AppleScript defines the keyword me to refer to the current script and the keyword it to refer to the current target. (The current script is the one that is currently being executed; the current target is the object that is the current default target for commands.) It also defines my as a synonym for of me and its as a synonym for of it.
If a script hasn’t targeted anything, it and me refer to the same thing—the script
From a practical POV, it seems to mostly refer to the script file name (no extension).
There is no direct parallel there.
‘this’ can be bound to the global context (the virtual parent of the set of top level objects exposed to the JSContext).
If it’s a pathname you want, you could write:
(function() {
    'use strict';

    var a = Application.currentApplication(),
	sa = (a.includeStandardAdditions = true, a);

	return sa.pathTo(this).toString();

})();
(For a link to the script file, rather than the broader context, you can drop the module enclosure)
i.e.
// (function() {
//     'use strict';

    var a = Application.currentApplication(),
	sa = (a.includeStandardAdditions = true, a);

	sa.pathTo(this).toString();

// })();
That returns:
"/Applications/Utilities/Script Editor.app"
That returns:
"/Users/Shared/Dropbox/SW/DEV/JXA/JXA How To/Misc/[CORE] Get Name of Me in JXA.scpt"
Are the this properties listed anywhere?
Of course, what I want returned is
Get Name of Me in JXA
which is what AppleScript would return for name of me
This gives me the path in a function:
var meStr = nameOfMe(this)
meStr
//-->"/Users/Shared/Dropbox/SW/DEV/JXA/JXA How To/Misc/[CORE] Get Name of Me in JXA.scpt"

function nameOfMe(pRefObject) {

    var a = Application.currentApplication(),
  sa = (a.includeStandardAdditions = true, a);

    return sa.pathTo(pRefObject).toString();
}
Are the
thisproperties listed anywhere?
There's no such thing. The name this gets bound to a variable computational context.
You ran it in one context in which it was bound the path of Script Editor, which was providing the evaluation - in another launch context it might yield the path to the Bash osascript command, in another the path of the script.
This would be one reference to the functions and bindings of this:
https://github.com/getify/You-Dont-Know-JS/tree/master/this%20%26%20object%20prototypes
This seems to work:
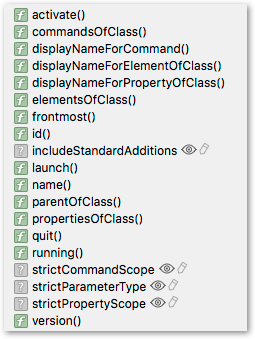
Object.getOwnPropertyNames(this)
RETURNS:
["NaN", "nameOfMe", "undefined", "Infinity", "parseInt", "Object", "Function", "Array", "RegExp", "EvalError", "RangeError", "ReferenceError", "SyntaxError", "TypeError", "URIError", "Set", "Map", "Date", "String", "Boolean", "Number", "Error", "ArrayBuffer", "WeakMap", "WeakSet", "Symbol", "eval", "JSON", "Math", "DataView", "Float64Array", "Float32Array", "Uint32Array", "Int32Array", "Uint16Array", "Int16Array", "Uint8ClampedArray", "Uint8Array", "Int8Array", "private", "delay", "parseFloat", "isNaN", "isFinite", "escape", "unescape", "decodeURI", "decodeURIComponent", "encodeURI", "encodeURIComponent", "console", "Automation", "Progress", "ObjC", "Path", "Library", "Ref", "$", "Application", "ObjectSpecifier"]
And that list will depend on what context this is bound to at the point of evaluation. It’s not the name of a particular object or interface, like Application. Those are the objects exposed in the global context. At other times it will return just the context of a particular function call.
With some help from @ComplexPoint (Rob) above, I have a solution:
var meStr = nameOfMe(this)
meStr
//-->"[CORE] Get Name of Me in JXA.scpt"

function nameOfMe(pRefObject) {

    var a = Application.currentApplication(),
  sa = (a.includeStandardAdditions = true, a);

    var pathScript = sa.pathTo(pRefObject).toString();
    var pathArr = pathScript.split("/")
    var nameScript = pathArr[pathArr.length - 1]

    return nameScript
}

Rob, that is a very cool very helpful list of methods.
When you have time would you mind explaining how you generated this list?
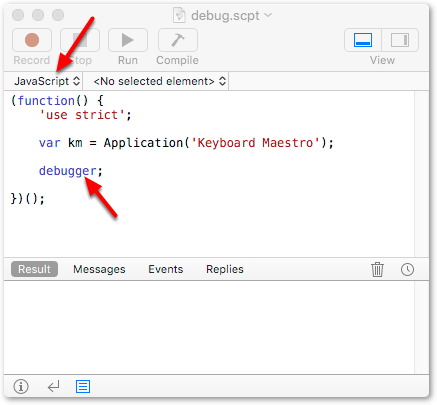
debugger statement

Thanks, Rob. That is very helpful.
Thanks again Rob for showing us how to invoke the Safari Debugger.
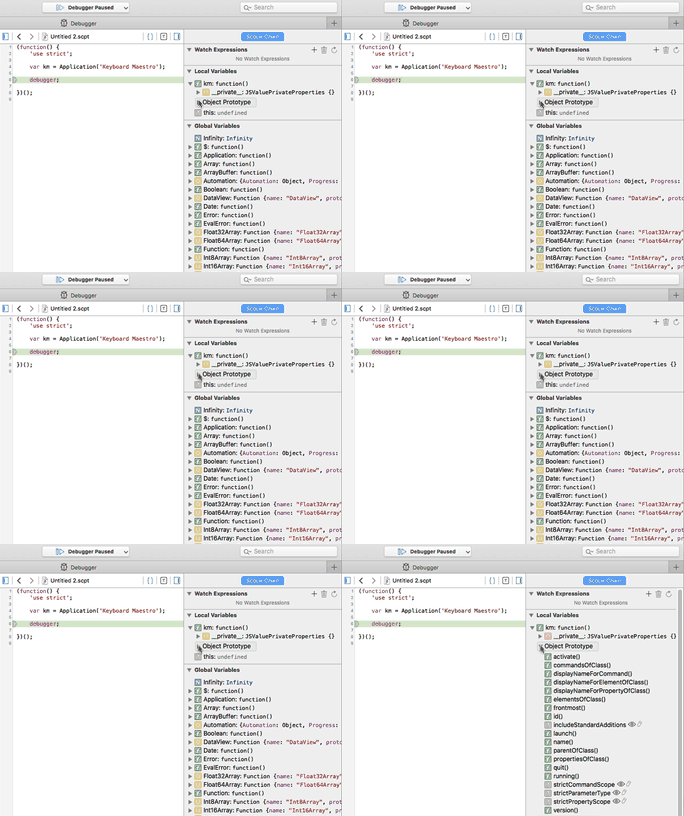
Building on Rob’s post, I have made a YouTube video of the complete process that I hope others will find useful. There are a few tricky steps.
How to Debug JavaScript for Automation (JXA) Scripts with Safari Debugger
The problem arose when at c. 3:12 you said:
“so you just close this window …”
(just is an interesting word, I think it often expresses a subliminal awareness that something could be a problem)
By closing the debugging session window you effectively terminate the current debugging session. Better to move or collapse the window, I think.
(Perhaps helpful to think of it as closing a browser tab – when you do that you lose the active model of the web page, or, in this more specialised case, the debugging session)
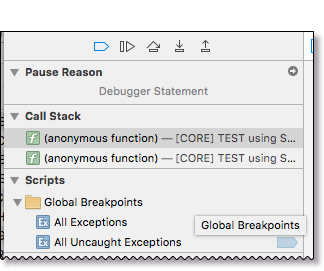
PS if you want to restart the debugging session which you ended by closing the debugging window, and reset any lost breakpoints, you can:
But I do want to terminate the debug session. I see no "Stop" button or other means to stop the script. If I click back in SE, I can't compile any changes, and clicking on the SE stop button does nothing.
So how would you propose to stop the script in Safari debugger, other than closing the window?
###safari Debugger Panel -- No Stop Button

I showed that exact process at the end of my video.
The script is paused at the green line (by the debugger statement), and will pause similarly at any breakpoints which you add. The debugging controls enable you to continue execution either to the next breakpoint, or to the next line, etc.
You end the script by allowing it to complete.
![]()
One you have done that, running the script again is enough (as long as there is at least one break point or debugger statement) to return focus to the debugging inspector.