The virtual memory size is not my concern. The "Real Memory Size" is a problem. This is a significant part of my actual memory. I know I can restart the engine and that will solve my immediate problem.
Is there something I can do to help the developers to identify the root cause of this problem. This is clearly a memory leak. Are there log files that can identify this? And yes I also killed all running macro's and when I took this memory snapshot, there were no macro's running.
After a restart the values are modest again, except the Virtual Memory Size is still high.
Are you doing a lot of "Type a Keystroke" actions? There's appears to be a memory leak there that manifests over a lot of typed characters, but it's in the Apple APIs KM uses (though reported by Activity Monitor as KM usage) -- see this thread for more.
Are you still having Clipboard History issues, and still not retaining history when quitting KME? It could be that this memory usage is just a symptom of that same problem.
And I worry about your post-restart figures -- hopefully you've typoed the first and last lines and they are actually "MB". If not, the problem is more likely your OS and mis-reporting rather than KME.
Here's what the Keyboard Maestro Engine looks like on my macOS 10.14.6 Mojave system shortly after quitting and restarting it from the Keyboard Maestro Editor:
I am using "Type a Keystroke" on a regular basis. If I lose 1MB of memory per keystroke it requires a 10,000 keystrokes to fill 10GB. That feels excessive.
My real question is can I make a change or can I find out what the root cause is here. I want to fix the bug, not change my behavior.
If you skim that thread you'll see it was "excessive" keystroking -- most likely botting a game. You'll know if you are doing something similar...
I'm not the best person to ask about "normal usage" of KM -- while I've written many macros I've only got around a dozen "production" macros that actually get used, and they're pretty weak-sauce. But if there was a general problem with KM and memory I would expect it to be all over the Forum (and, since @peternlewiseats his own dog food, for it to impact him and be fixed very quickly!).
Which makes it more than likely that it is something you are doing, or that is related to your particular setup. Do you see this memory creep all the time? Zoom in on any macros that are always running or have an high-frequency periodic trigger. Only after certain workflows? Check any macros related to that. Are you still having Clipboard History issues as well? Try turning that off for a bit? Do you use a lot of "Execute..." actions (shell script, AppleScript, even other macros)? Processes spawning processes can often be a cause of memory leaks.
The more you can narrow things down, the easier it will be when you come to submit an "official" ticket (which, I suspect, is ultimately what will be required).
The problem is not there all the time. I just notice it from time to time because my machine starts to slow down. When I then see the problem I have a script to restart the engine.
I understand that limiting the scope can help support to pinpoint the problem. My problem is that I don't know what actually causing it, nor do I know when it actually happened. My activity that caused it could be an hour ago at the time that I notice. This is why I am asking for a setting or something else that can help identify what part of the application is holding the memory.
I tried to connect to the running process using lldb but that somehow doesn't seem possible. The error I get is "attach failed: this is a non-interactive debug session, cannot get permission to debug processes."
Graph that file, look for suspicious changes (eg usage jumps but doesn't then drop back over time), correspond the (epoch seconds) time stamp to the KME log's trigger events for the 5 minutes before, see if one or more triggers are consistently flagged.
If there aren't any obvious jumps then that's evidence of a more general problem -- useful data for a support ticket.
You could also use the above to automate an Engine kill/relaunch whenever memory usage went above a certain level!
Any memory leak I have ever been able to successfully track down has been resolved, but that said, they are very rare, and generally not something I can reproduce. I can't remember the last time there was a memory leak that I could reproduce usefully.
If there is going to be a memory leak, the likely cause is something that uses a large amount of memory (image stuff for example) - otherwise a small memory leak is likely to take forever to become noticeable.
Also note that slowing down the Mac is generally unlikely to be related to a memory leak - by definition, memory leaks are abandoned memory which is not likely to affect performance.
If you can find a way to reproduce a memory leak, I am happy to look in to it, but without that information of exactly how to is happening such that I can duplicate it, it is virtually impossible for me to even start.
I may have a candidate for you to look at. Unfortunately you have to play a game in order to play it.
I use this macro in the game Elvenar. The macro calls another macro conditional sound which is there just for debugging. Sound was not enabled.
This is the full log during this period. So nothing else was executed. And during the same time the memory crontab dump shows:
Sat Dec 10 08:35:00 CET 2022 1670657700 1107844
Sat Dec 10 08:40:00 CET 2022 1670658000 1110656
Sat Dec 10 08:45:00 CET 2022 1670658300 1141924
Sat Dec 10 08:50:00 CET 2022 1670658600 1315096
Sat Dec 10 08:55:00 CET 2022 1670658900 1315144
Sat Dec 10 09:00:00 CET 2022 1670659200 1315332
Sat Dec 10 09:05:00 CET 2022 1670659500 1309272
As you can see the memory usage jumped by 16MB and is never released. Normally I use this macro only a couple of times a day and never within a short time period. I just thought that this could be a suspect because it uses a method to look at images on screen which I use very frequently to automate boring tasks in a browser window. The crontab entry to produce this line is the following:
Maybe you already know this but because I look for images all the times the resolution of screen and the browser settings have to match. Maybe this is the time to request a feature improvement. It would be so nice if the images are stored and matched using a normalized PPI dimension.
I have some additional information. In the cron log I saw the following pattern:
Tue Dec 13 12:40:00 CET 2022 1670931600 126592
Tue Dec 13 12:45:00 CET 2022 1670931900 747556
Tue Dec 13 12:50:00 CET 2022 1670932200 2195036
Tue Dec 13 12:55:00 CET 2022 1670932500 2383200
As you can see the memory jumped from 125M to 2.4G in a short period.
In the engine log I can see I only run a single command twice during that period which is a command that didn't end well. They kept running in the background. An hour later the size was 3.70GB.
I do frequently see the following message in the Engine.log (there are more entries than listed here):
2022-12-13 14:29:24 Running application query took a while (3514 us)
2022-12-13 14:29:29 Running application query took a while (4027 us)
2022-12-13 14:29:29 Running application query took a while (5947 us)
2022-12-13 14:29:31 Running application query took a while (3585 us)
2022-12-13 14:29:32 Running application query took a while (5706 us)
2022-12-13 14:29:33 Running application query took a while (3714 us)
2022-12-13 14:29:35 Running application query took a while (4966 us)
2022-12-13 14:29:35 Running application query took a while (7217 us)
I then cancelled the macros at which time the memory usage was 4.27GB and then after 5 minutes after the cancel the memory consumption did not change.
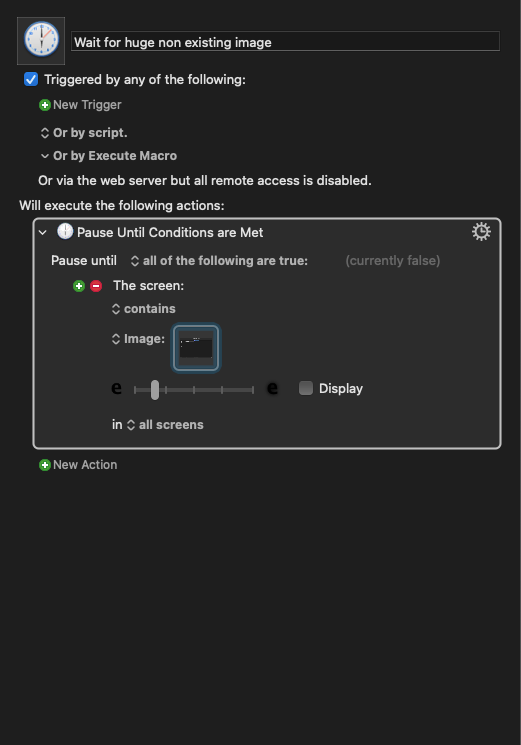
My next experiment was to start the macro again and I noticed that it was hanging again. The debugger revealed that it was hanging on a step where KM is pausing until a given image is visible. The memory size did NOT significantly increase this time. It was still around the 4.27GB.
I then started the same macro a second time when then also was hanging. The debugger showed it was hanging in the same step. In 5 minutes the memory consumption jumped from 4.27GB to 4.59GB. So it seems that context switching influences the memory leak.
I then cancelled all macro's again. I created the following macro:
I run 4 concurrent tasks of this macro. The size jumped from 4.59GB to 5.63GB. I then cancelled them and started 4 new ones. The size now jumped from 5.63GB to 6.10GB. I then waited another hour and the size increased to 6.96GB. The size of the image may influence the size of the memory leak but I don't find this evidence convincing yet.
I hope this information help is tracing this down.
Out of interest -- what happens if you set the action's timeout to 1 minute and let it end "properly" rather than by cancellation? Does that result in a memory usage rise-then-fall when the macro ends, or does it stay high?