Execute JavaScript in (Safari or Chrome) actions enable all kinds of useful interactions with browsers, and are perhaps a bit easier to draft than they look.
The trick is ⌘⌥I, which lets you step through your running JS code line by line, watching the variable values change, and inspecting the properties of objects, in the browser's symbolic debugger.
In either browser, you can select something on the web page, and use ⌘⌥I or "Inspect Element" in the Ctrl-click contextual menu.
(In Safari, you may first need to enable the 'Developer Menu' through Preferences > Advanced).
I personally prefer to use the Chrome tools (easier XPATH searches), but both hugely reward the effort of some patient exploration and experimentation. The debugger is really the best place to watch it all happen in slow motion, and learn how it all works.
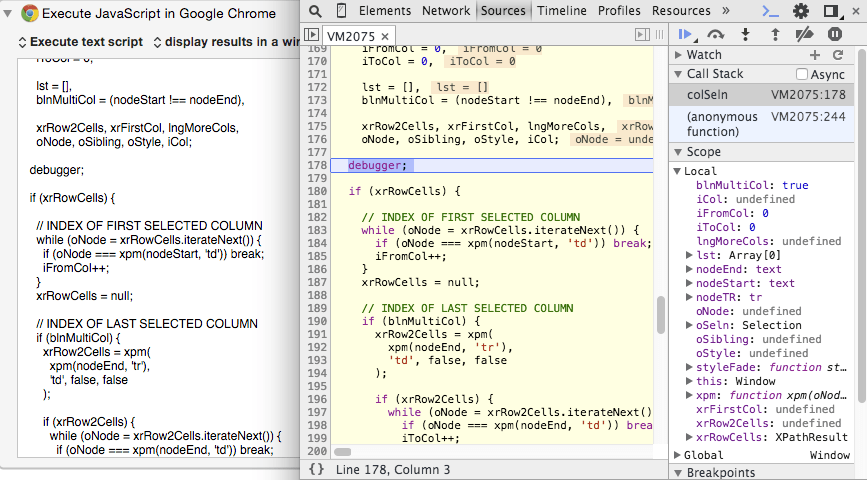
To make the execution of your JavaScript action pause at a point of interest, allowing you to start stepping through the execution line by line, insert a line which simply consists of:
debugger;
in your code.
In the next version of OS X, you will be able to do this with JavaScript for Applications automation code from Script Editor.
(You can already use Script Editor to draft your Browser Javacript code, converting the function which will be used in the browser to a string, and submitting it for browser execution using the techniques shown in this post: