In a discussion thread on this forum about displaying data in a chart, I found I didn't like most of the solutions, largely because they involved obtaining or using other software/libraries. So I wrote this to solve the problem using nothing but KM actions. I call it "Graphene." It's a macro that normally will be triggered by an Execute Subroutine action in your KM macros. It will draw either a "bar chart" or a "dot chart" from your list of numeric values. (Your data should be separate either by commas or newlines.) If you don't pass it any data, it will generate some random data so you can see how it looks.
Graphene Macro (v11.0.1)
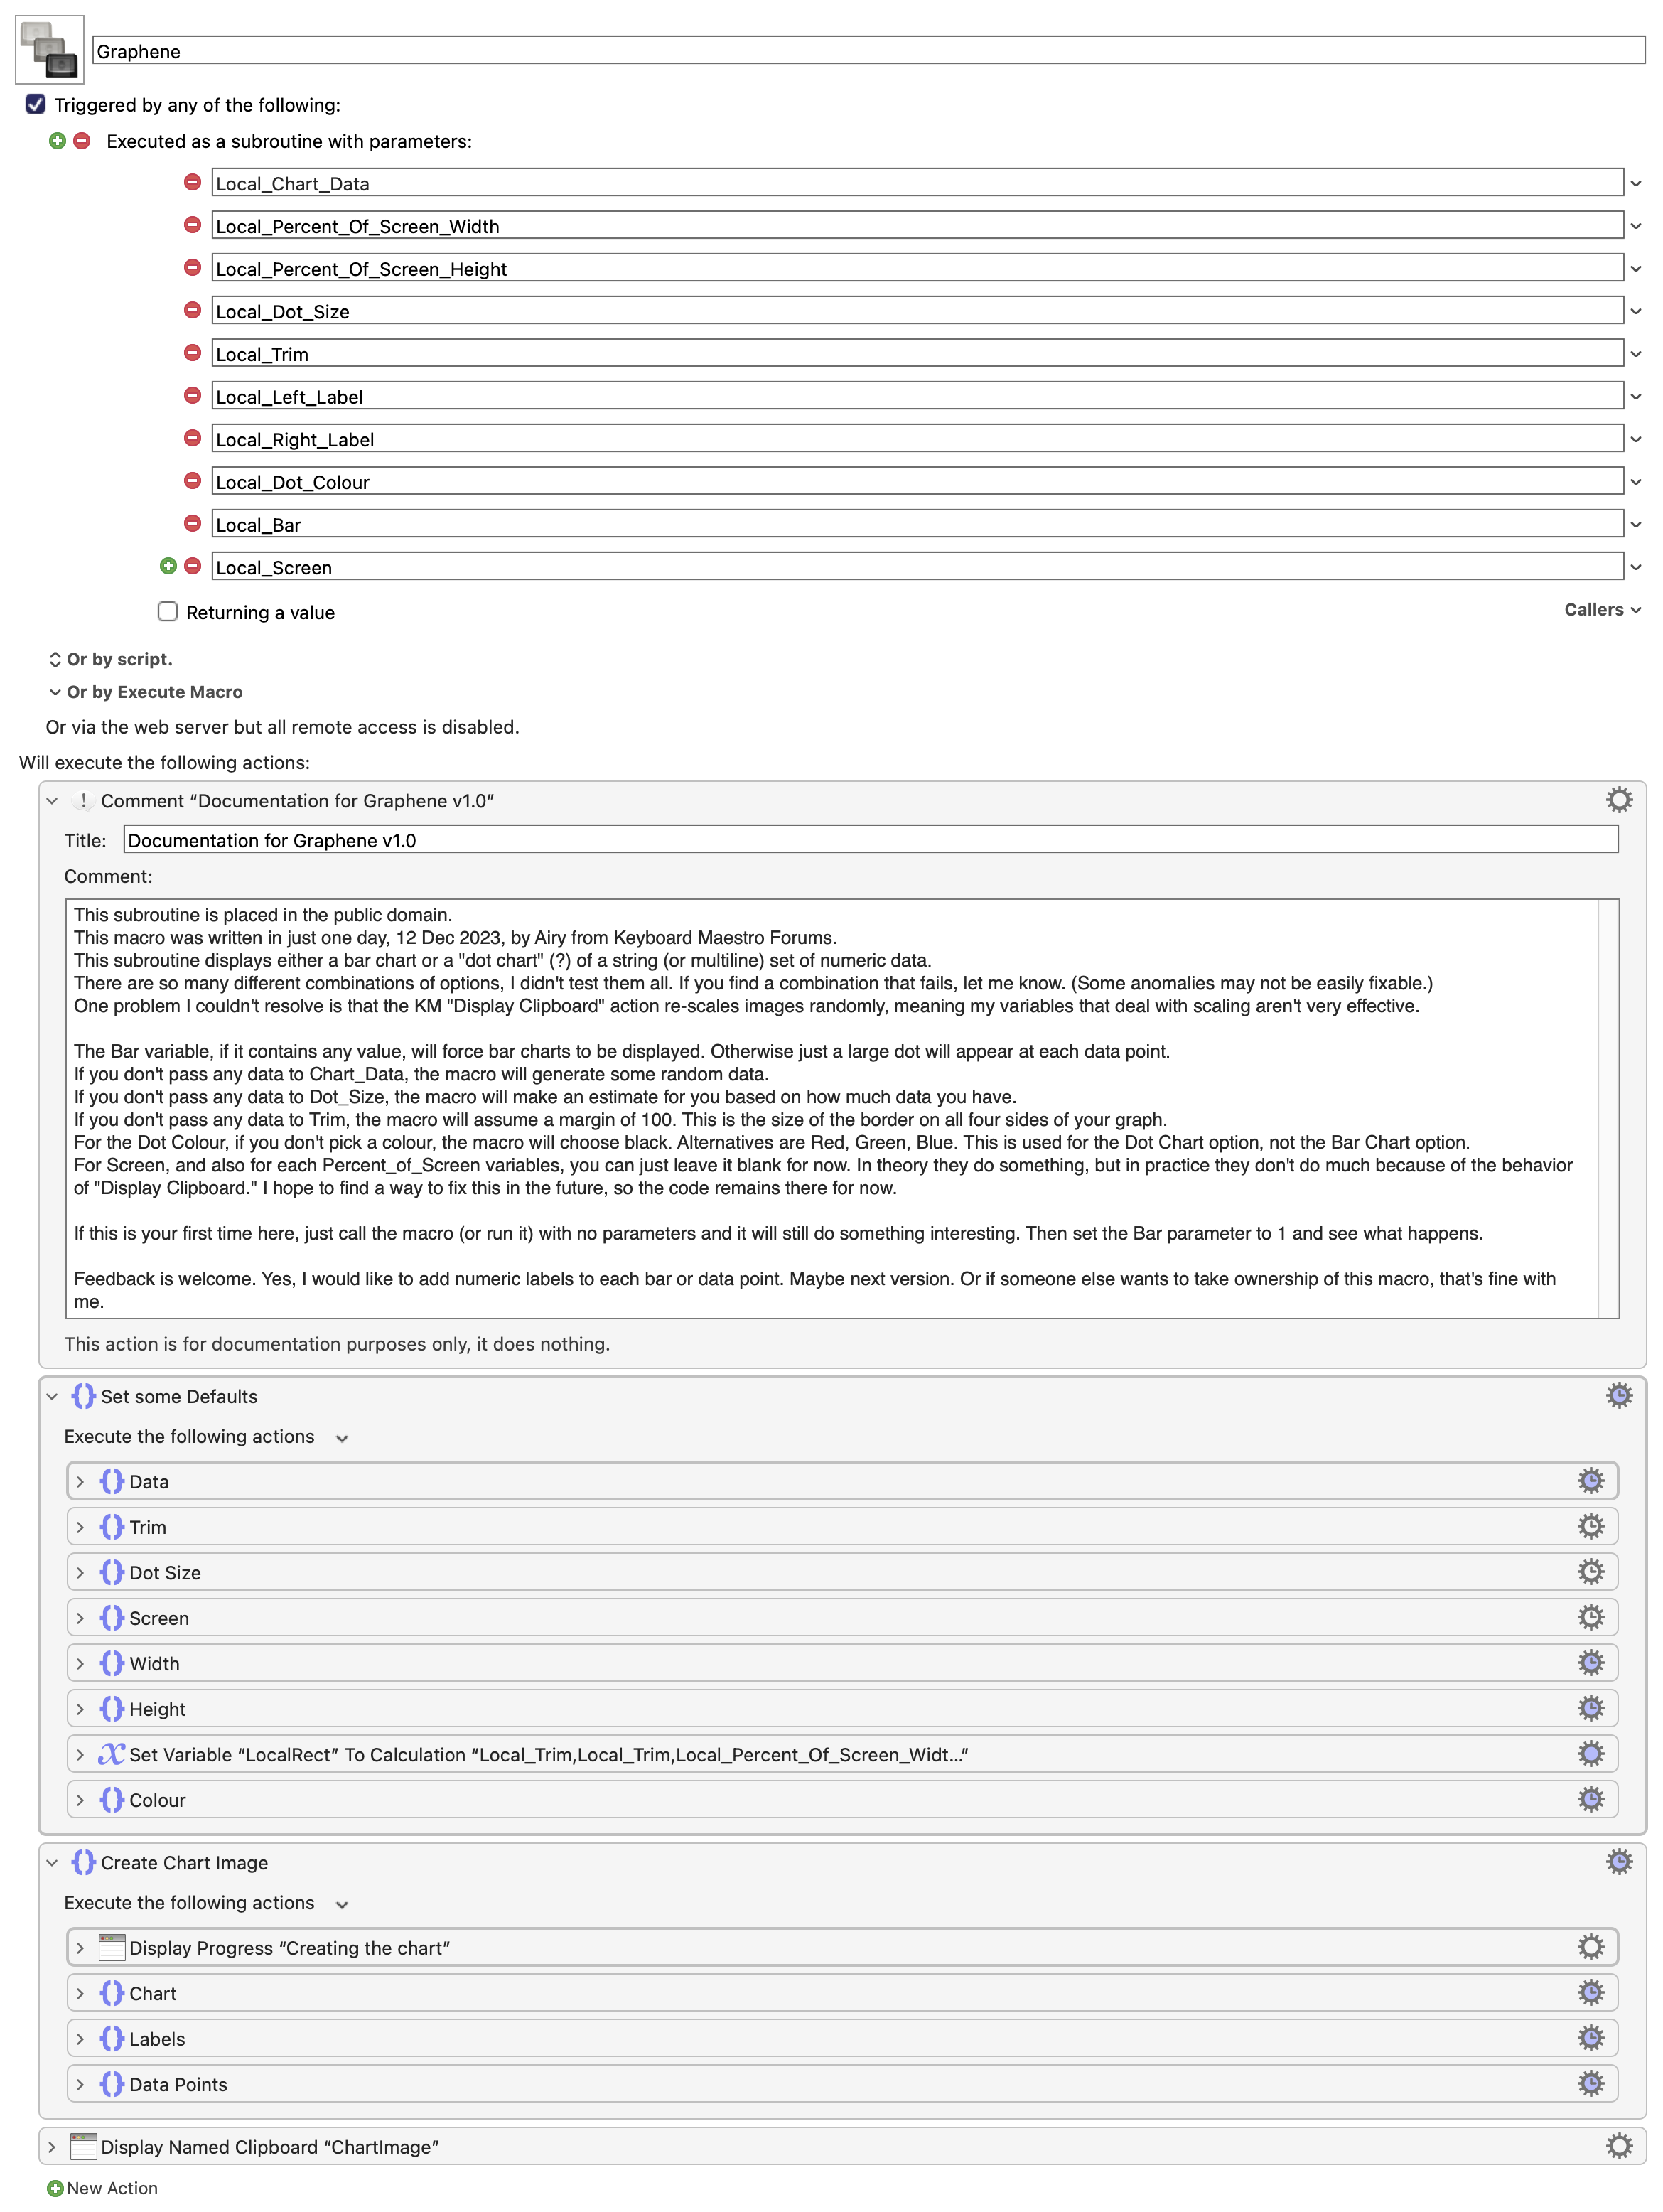
Graphene.kmmacros (81 KB)