How To Use "VS Code" for JXA, with Keyboard Maestro

UPDATED 2019-09-10, around 09:30am PDT

CHANGE LOG

2019-09-10, around 09:30am PDT: I discovered how to no longer need the "shebang" in your script file.

2019-09-10, around 08:30am PDT: I found what I think is a much easier way to run JXA code from VSCode. So I've rewritten most of this post.

Visual Studio Code (VSCode)

I have been successfully using VSCode to compile and run JavaScript for Automation (JXA) for a while now. I thought I'd share what I've learned, and I'll answer any questions I can.

VSCode vs. Atom

As far as compiling and running JXA scripts, I think they're about the same. There's no debugging that I'm aware of in either of them.

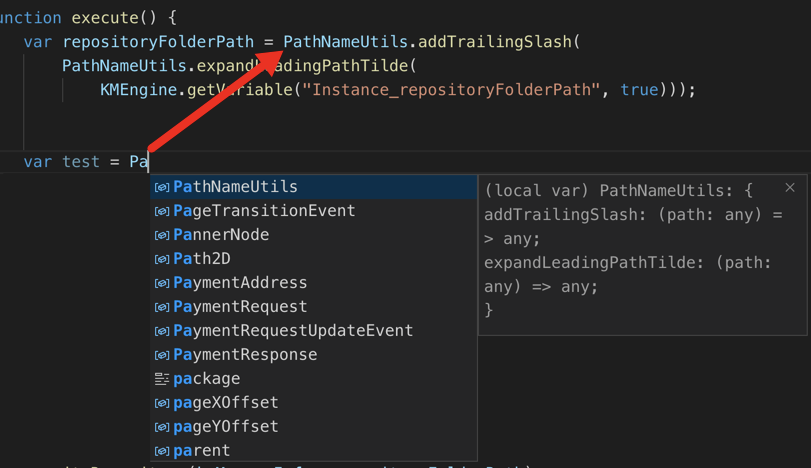
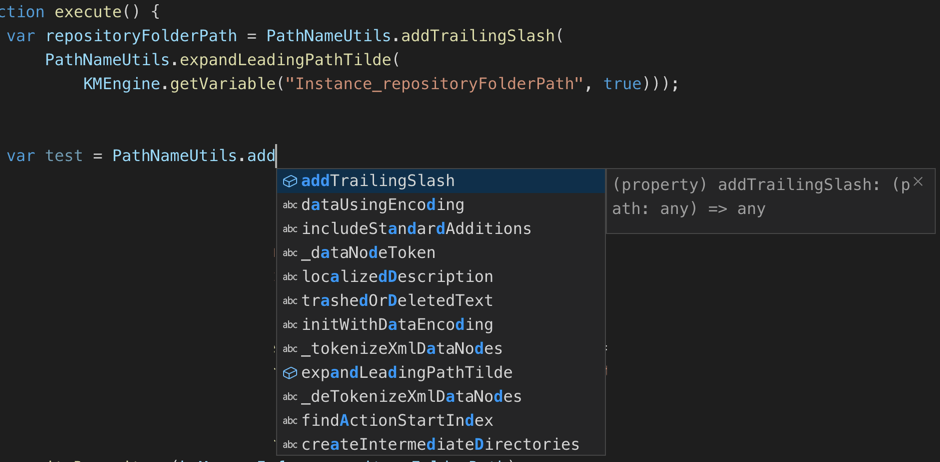
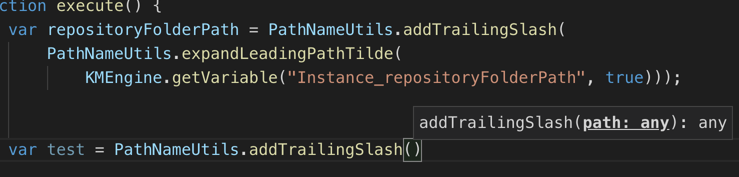
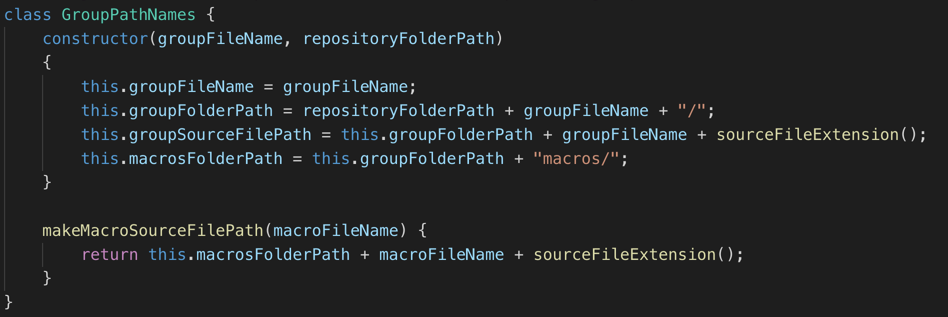
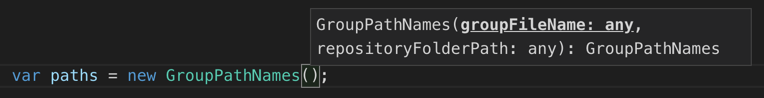
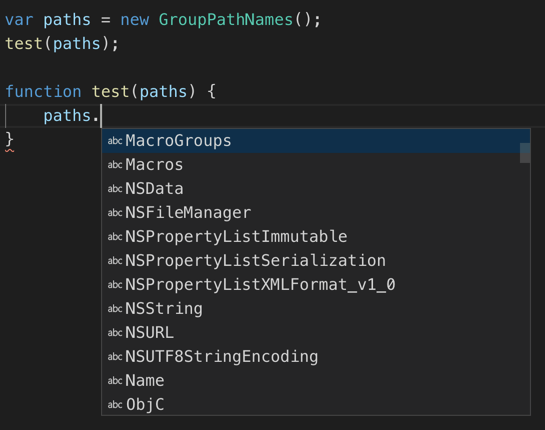
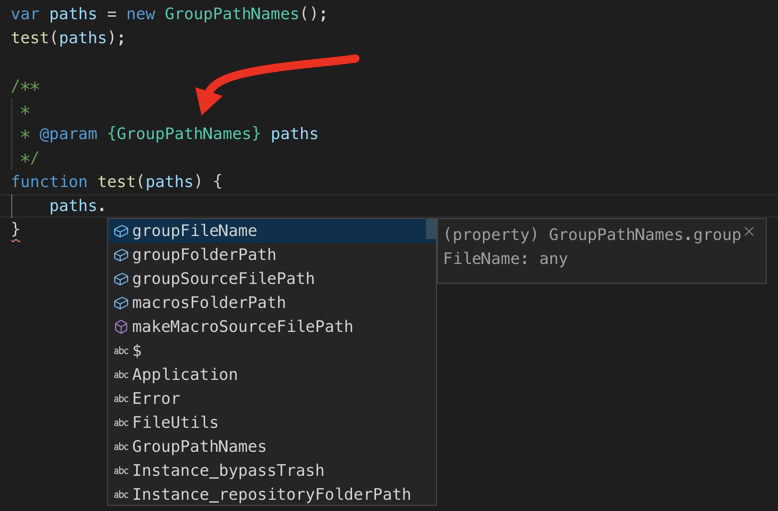
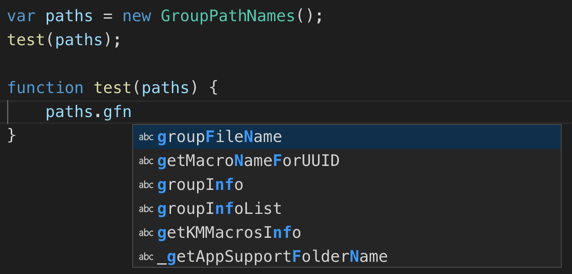
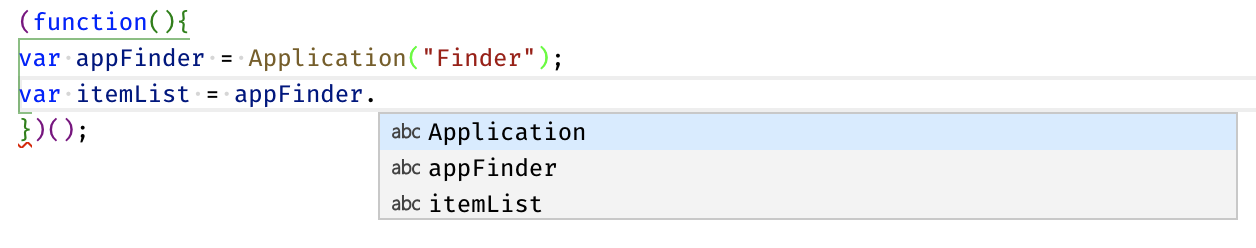
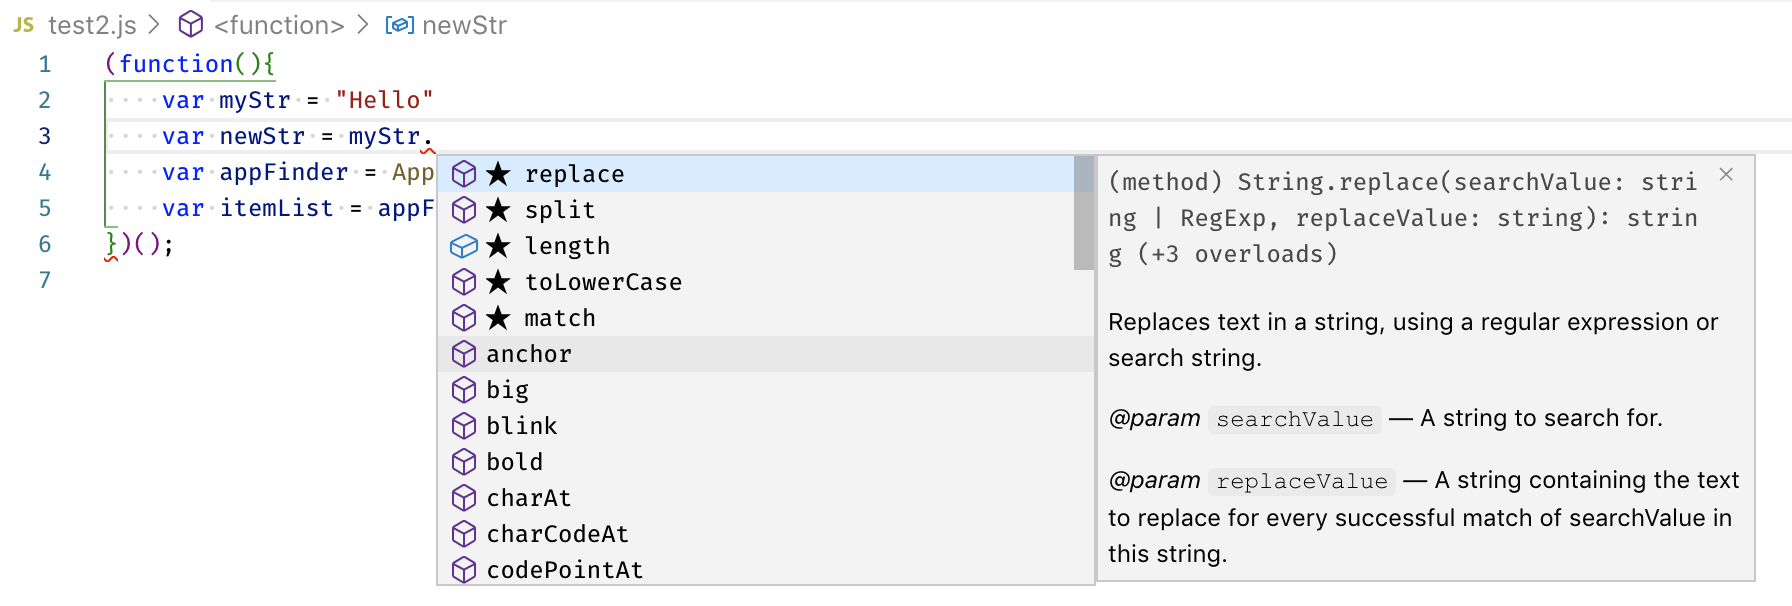
As far as editing is concerned, VSCode is light-years ahead of Atom. VSCode gives you the full range of tools when working with JavaScript. Code completion, real-time syntax checking, Find All References, symbol renaming, Intellisense, region folding, the list goes on and on. I'm sure I'm forgetting some obvious things.

Installation

Download the Mac version from https://code.visualstudio.com/. If memory serves, you have to unzip it, then drag the app to the Applications folder.

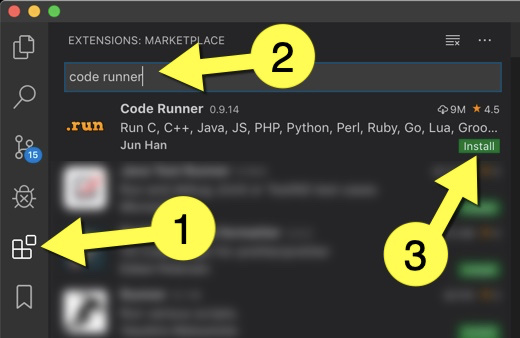
Then (1) Click the Extensions button on the left, (2) Search for "Code Runner", and (3) Install it:

image

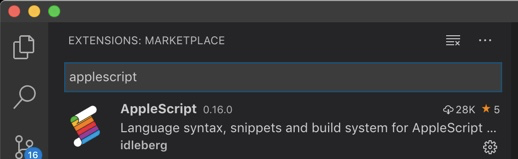
You'll probably also want to install the "AppleScript" extension, which also supports JXA (more on this later):

image

"Code Runner" vs. "AppleScript" extension

Both of these extensions add support for running JXA scripts. I'm going to explain what I think is the best way to use either of these.

Language Mode

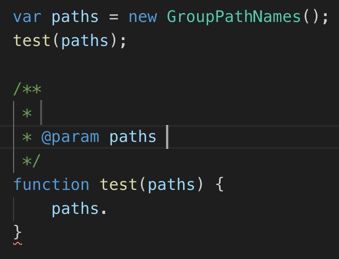
I strongly recommend editing your JXA scripts using the "JavaScript" Language Mode. This gives you full editor support for the language, as I mentioned at the start.

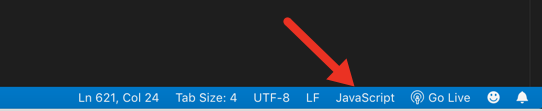
So, whatever extension you use for your JXA files, make sure it's associated with "JavaScript". Open one of your JXA files, and in the bottom right (yellow arrow) make sure it says "JavaScript":

image

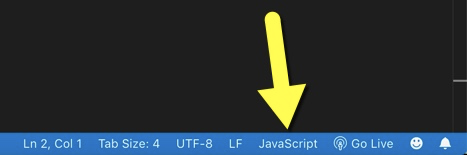
If it doesn't say "JavaScript", click whatever it says (yellow arrow above) to bring up this window:

image

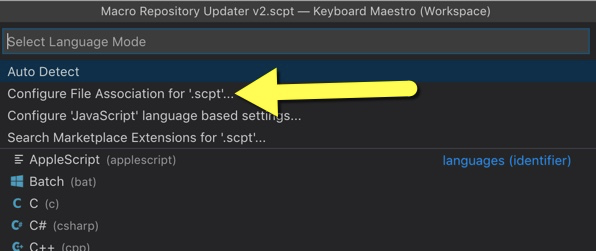
...and change the association to JavaScript (yellow arrow).

You can now edit your JXA scripts with full editor support, as mentioned above.

Running JXA Scripts with the "Code Runner" extension

The easiest way to run your JXA scripts is with the "Code Runner" extension.

1) Edit your user settings:
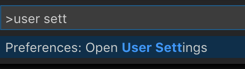
  1. Press Shift+Command+P, type in "user settings", and "Open User Settings":
    image

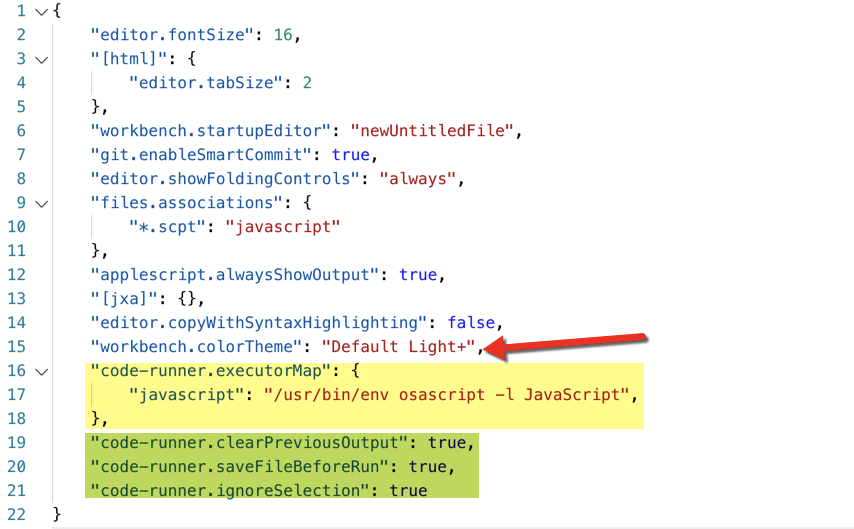
  2. It's a standard JSON file. Yours might be empty. Add the lines shown in yellow, and optionally add the lines shown in green:

    "code-runner.executorMap": {
        "javascript": "/usr/bin/env osascript -l JavaScript",
    },
    "code-runner.clearPreviousOutput": true,
    "code-runner.saveFileBeforeRun": true,
    "code-runner.ignoreSelection": true
    

2) Use the "Code Runner" extension to run the code.

Here's some ways to do that:
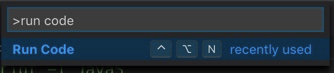
  1. Press Shift+Command+P to bring up the command window, and type in "Run Code:
    image

    -or-

  2. Use the "Run Code" shortcut as shown above, Control+Option+N

Compiling and Running JXA Scripts using the "AppleScript" extension

If you installed the "AppleScript" extension, you can use it to save compiled versions of your script.

I still recommend editing your JXA scripts using the "JavaScript" Language Mode (see note below).

When you're ready to compile or run your script, do the following:

  1. Change the Language Mode to "JavaScript for Automation (JXA)".

  2. Follow the instructions in the "AppleScript" extension for how to compile.

NOTE:

When the Language Mode is set to "JavaScript for Automation (JXA)", you only get rudimentary editor support. You don't get all the cool features like code completion, etc.

That's why I prefer to work with the Language Mode set to "JavaScript", and either use "Code Runner" to run it, or switch to "JXA" and use the "AppleScript" extension when I want to compile it.

7 Likes

That's fantastic, Dan! :+1:

Thanks for doing all the work to make VSC work with JXA, and then for the great job in documenting it for others like me to use. I'll definitely use your system.

So, I take it that you could not make debugging of JXA work through Safari, like we can with Script Editor?

OK, maybe I missed your "later" comments, but here's my question:
.scpt is normally a compiled file, from Script Editor. I don't see how that would open in VSC, which is text only.
So do you mean that you used the Finder to associate .scpt with a text format?

I think I may have found one typo:

Did you mean change to "JXA"?

So does that mean application objects you have created using JXA don't provide any auto-completion? For example, if you:

var appFinder = Application("Finder");
var itemList = appFinder.selection();

then when you type appFinder., does it offer any autocompletion?

I generally do like to run my scripts in KM from a file. What will I need to change in your system to make that work?

Thanks, again.

Thanks, Jim! I was hoping someone would find it interesting, so it means a lot to me that you're looking into this. :smile:

NOTE: I'm withdrawing the rest post of this until I research something I just found. I'll post back later.

1 Like

I've rewritten my instructions. Let me know what you think.

Dan

1 Like

Updated again. You don't need a "shebang" in your JXA file, after all.

And in case I didn't make it clear, and I probably didn't, this means you can use VSCode with your script files with no problem.

And I'll bet that if you want to actually save the compiled script when using "Code Runner", @ccstone could figure out how to do it, because you just need to put the BASH command(s) in the user settings file.

I'm done bugging you on this issue. I hope. :stuck_out_tongue:

Hello Dan,

Abig thank you for sharing this!

I followed the steps you outlined, and was able to run a simple script.

Have some questions for you,

  1. In this setup, does autocomplete / intellisense work for JXA scripts?
  2. When debugging in Safari, using the debugger; command, is there a way to see or review the properties and methods / functions of any given object?
  3. Why associate .scpt files with Javascript? .js files seem to run for me.
  4. When I run the simple script iwht debugger; command, the Safari window does not open by itself. I need to select it from the Develop menu. Have you faced this.

Again, thank you for sharing your JXA IDE setup.

You're quite welcome.

  1. Autocomplete and intellisense work when the language mode is JavaScript.
  2. I think there's some other threads on using Safari for debugging JXA scripts. They're probably for Atom, but I think they're still relevant. I don't remember the details.
  3. ".js" is fine. I've just always used ".scpt"., for some reason.
  4. See answer to #2.

Hope that helps.

Thanks for the quick reply. I will search for the threads that you refer to. I did actually review a lot of threads a few months ago, and earlier today as soon as I finished reading up on javascript.

Another question, as I made some progress based on reading here.
So based on this video by @JMichaelTX, I created a script like so.

(function() { 
    'use strict';
    debugger;
    var kmApp = Application('Keyboard Maestro');
})();

At this point, I see 54%402x
in the expressions panel, however, quite a few properties, that are visible in the dictionary are missing from this view. The dictionary view -

.

So, while version() is seen in Safari view, selection is not. The properties are partially there but other commands that the application responds to are missing - such as open, print, quit etc.

Would be great to be able to see that stuff... And would be even better if those could auto-complete and I could test out what those things to in the console when in debugger mode. :smile:

Do these things work for you, or how else do you debug or do you have dictionary open.

Hope my question made sense.


Editing the post to say that I "discovered" :slight_smile: 
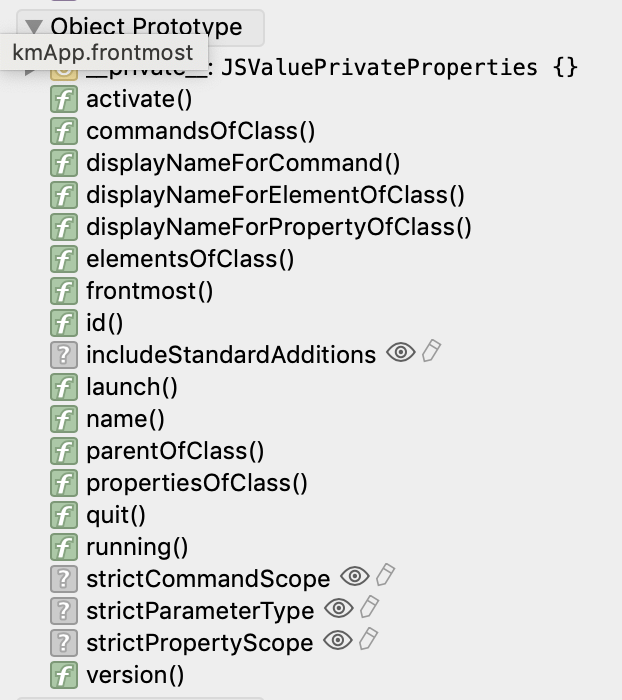
that in console if I type kmApp.properties(), then I can see the value of properties and what I was looking for. But those details are not quite visible in the "Local Variables" panel of the debugger. Sounds like it is something everybody would want to be able to see when debugging, and so I wonder if those details can be seen in the Local Variables panel.

Thanks.

So I saw your comment on the youtube video, and you advised there that the script should be compiled and then run and then the Safari window will open. Is there a way one can compile the script while using code runner and VS Code?

Thanks!

Yes, I can confirm that. I'm not sure why, but for some reason the Safari debugger does NOT expose the application properties directly. As you discovered, you have to "get" the properties before you can see them in the debugger.

Another KM forum member, @ComplexPoint, has done considerable work with JXA and the Safari debugger, perhaps he can comment if he has time.

Thanks for the reply. I do home that @ComplexPoint picks this up. I notice that @ComplexPoint did something here in this answer to make the details appear, but that is a lot of javascript just to see what is inside an object.

In the meantime, how do you or @DanThomas poke around as to what is available to be called in an object if you cannot see it easily in Safari debugger? And .properties only shows the properties right, what about the functions available in that object?

1 Like

If Chrome would expose these, I would happily use Chrome. I just read a reference somewhere that one can also debug JXA in Chrome, and I will try to figure that out.

Same way I do using Script Debugger: Set a variable to the object or property list of interest.
For example:
var kmProps = kmApp.properties();

AFAIK, no debugger provides functions/methods associated with an object. You need an IDE with auto-completion, or the Scripting Dictionary to see the app's methods:

1 Like

Thank you again for your reply.

I guess I need to figure out how to use the right IDE for JXA scripting. Are you using Script Debugger for JXA? Does it autocomplete and all that?

@DanThomas Looks like you are using VS Code but using your approach I am not able to autocomplete :(. I followed the steps. I wonder if I need to install and configure something like https://github.com/johnelm/node-jxa. But seems like @DanThomas, you are managing to use VS Code and get JXA autocompletion without node-jxa.

I am in deep waters. :cry:

Well, we are all looking for that holy grail! :wink:

No. SD only supports AppleScript.

Dan has done some great work, but it only allows JavaScript autocompletion in JXA scripts. It does NOT auto-complete for JXA application objects.

Please try anything you think might work. I keep feeling like there is a solution out there just beyond our grasp.

So where do you do this? In Script Editor or Atom or VS Code, and then do you run and attach the script like in your video to Safari, and then see what is in kmProps in the Safari debugger?

That seems so painful compared to what is possible using the Python extension in VS Code.

I so agree that there has got to be some holy grail that @ComplexPoint say uses. He seems to be able to come up with scripts with such ease. Almost like play activity :slight_smile:

Of course, you are way advanced as well, with your macros, applescripts and frankly even JXA.

Many many thanks for your help and engagement.

So I figured that one way to do this is to launch the script in debug mode, and see the value of KmProps in the Safari debugger console.

1 Like

I'm not sure why you're having issues with autocomplete.

Make sure it says "JavaScript" in the bottom right:
image

Here's an example. I'm starting to enter PathNameUtils like where the arrow points, and you can see I get a completion list:

Now I'm starting to enter AddTrailingSlash, and it shows the property and its definition:

Once I type the opening paren, it shows parameter information:


There are some objects VSCode can't give you Intellisense for, like this:

var obj = { firstName: "Dan", lastName: "Thomas" };

If you pass it as a parameter to another function, VSCode won't know what it is.


However, if you have a class definition like this:

...and you start using it, VSCode will provide Intellisense:

If you pass it as a parameter into a function like this, VSCode doesn't know the definition of "paths":
image

But, you can create JSDoc comments for the function. Start by typing \** and hitting return:
image

Then modify the parameter definition to add the "type", as show by the red arrow, and now you get true Intellisense completion:

So basically, you have to give VSCode some way to infer the object type, if you want actuall Intellisense. Otherwise it just gives you a list of all the names it knows about.

Which isn't horrible, by the way, because you can type just a few letters to get the list filtered down, like here where I typed gfn:
image

There's tons of stuff like this. I know some of this because I used Visual Studio during my professional development career, and VSCode has a lot of similarities.

Oh, and regarding properties, I've never been able to figure them out like how Jim shows. So I just use a lot of console.log() messages along with JSON.stringify(). I'd rather do it like Jim mentioned, but I can't seem to remember to try it, and I just resort to the old tried-and-true methods.

However, when dealing with JXA automation objects, after a while you start to understand the naming conventions compared to AppleScript, and it gets easier.

Hope this helps.

1 Like

Thank you for the detailed reply. I will have to work through and absorb everything one by one.

I installed CodeRunner and also AppleScript extension. Language is Javascript at the bottom right of VS Code and checked by invoking cmd-shift-P and then lang and configured language is javascript. File name also ends in .js

However, I am not seeing any JXA related code completions. For example here:

.

And when I try and type the code that you have in your example, this is what I get.

Of course, I am doing something wrong. Are there extensions that I should check for, or any specific settings in VS Code.

I do have basic javascript code completion / intelligence in VS Code.

May be this is how it should be and the code completion that I am not seeing is a result of not importing some js library.

Thank you!