JavaScript / JXA Q&A

That returns:
"/Applications/Utilities/Script Editor.app"

That returns:
"/Users/Shared/Dropbox/SW/DEV/JXA/JXA How To/Misc/[CORE] Get Name of Me in JXA.scpt"

Are the this properties listed anywhere?

Of course, what I want returned is
Get Name of Me in JXA

which is what AppleScript would return for name of me

This gives me the path in a function:

var meStr = nameOfMe(this)
meStr
//-->"/Users/Shared/Dropbox/SW/DEV/JXA/JXA How To/Misc/[CORE] Get Name of Me in JXA.scpt"

function nameOfMe(pRefObject) {

    var a = Application.currentApplication(),
  sa = (a.includeStandardAdditions = true, a);
  
    return sa.pathTo(pRefObject).toString();
}

Are the this properties listed anywhere?

There's no such thing. The name this gets bound to a variable computational context.

You ran it in one context in which it was bound the path of Script Editor, which was providing the evaluation - in another launch context it might yield the path to the Bash osascript command, in another the path of the script.

This would be one reference to the functions and bindings of this:

https://github.com/getify/You-Dont-Know-JS/tree/master/this%20%26%20object%20prototypes

This seems to work:

Object.getOwnPropertyNames(this)

RETURNS:

["NaN", "nameOfMe", "undefined", "Infinity", "parseInt", "Object", "Function", "Array", "RegExp", "EvalError", "RangeError", "ReferenceError", "SyntaxError", "TypeError", "URIError", "Set", "Map", "Date", "String", "Boolean", "Number", "Error", "ArrayBuffer", "WeakMap", "WeakSet", "Symbol", "eval", "JSON", "Math", "DataView", "Float64Array", "Float32Array", "Uint32Array", "Int32Array", "Uint16Array", "Int16Array", "Uint8ClampedArray", "Uint8Array", "Int8Array", "private", "delay", "parseFloat", "isNaN", "isFinite", "escape", "unescape", "decodeURI", "decodeURIComponent", "encodeURI", "encodeURIComponent", "console", "Automation", "Progress", "ObjC", "Path", "Library", "Ref", "$", "Application", "ObjectSpecifier"]

See:
Object.getOwnPropertyNames()

And that list will depend on what context this is bound to at the point of evaluation. It’s not the name of a particular object or interface, like Application. Those are the objects exposed in the global context. At other times it will return just the context of a particular function call.

With some help from @ComplexPoint (Rob) above, I have a solution:

var meStr = nameOfMe(this)
meStr
//-->"[CORE] Get Name of Me in JXA.scpt"

function nameOfMe(pRefObject) {

    var a = Application.currentApplication(),
  sa = (a.includeStandardAdditions = true, a);
  
    var pathScript = sa.pathTo(pRefObject).toString();
    var pathArr = pathScript.split("/")
    var nameScript = pathArr[pathArr.length - 1]
    
    return nameScript
}


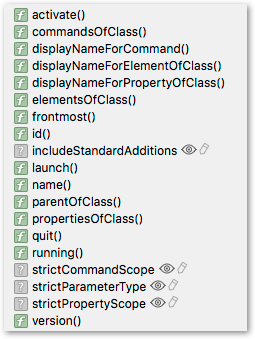
Rob, that is a very cool very helpful list of methods.
When you have time would you mind explaining how you generated this list?

  1. Look at the notes on debugging JSA in Safari, and perhaps also at Dan's macro.
  2. Create a script in which the binding of an Application instance reference to variable name is followed by a debugger statement
  3. Drill down to the object prototype of the Application instance
2 Likes

Thanks, Rob. That is very helpful.

Thanks again Rob for showing us how to invoke the Safari Debugger.

Building on Rob’s post, I have made a YouTube video of the complete process that I hope others will find useful. There are a few tricky steps.

How to Debug JavaScript for Automation (JXA) Scripts with Safari Debugger

The problem arose when at c. 3:12 you said:

“so you just close this window …”

(just is an interesting word, I think it often expresses a subliminal awareness that something could be a problem)

By closing the debugging session window you effectively terminate the current debugging session. Better to move or collapse the window, I think.

(Perhaps helpful to think of it as closing a browser tab – when you do that you lose the active model of the web page, or, in this more specialised case, the debugging session)

PS if you want to restart the debugging session which you ended by closing the debugging window, and reset any lost breakpoints, you can:

  1. Return to the Safari Develop menu, and the [machine name] item
  2. Find and select from a list of available debugging windows the one which bears the name of your script
  3. Optionally create new breakpoints (click on left margin of a script line) or adjust the cleared debugging session options (left panel)
  4. Run the script again

But I do want to terminate the debug session. I see no "Stop" button or other means to stop the script. If I click back in SE, I can't compile any changes, and clicking on the SE stop button does nothing.

So how would you propose to stop the script in Safari debugger, other than closing the window?

###safari Debugger Panel -- No Stop Button


I showed that exact process at the end of my video.

The script is paused at the green line (by the debugger statement), and will pause similarly at any breakpoints which you add. The debugging controls enable you to continue execution either to the next breakpoint, or to the next line, etc.

You end the script by allowing it to complete.

One you have done that, running the script again is enough (as long as there is at least one break point or debugger statement) to return focus to the debugging inspector.

Not sure if this is the latest version, but it covers the main ground:

https://developer.apple.com/library/mac/documentation/AppleApplications/Conceptual/Safari_Developer_Guide/Debugger/Debugger.html

Obviously, there are times when debugging you do NOT want to allow the script to complete.
So, I guess my approach of closing the window is the only way to terminate the script when it is paused in Safari Debugger.

Thanks for reviewing my video and providing feedback.

However your psychoanalysis of the speaker is wrong and inappropriate. Just for your edification, "just" is used by many Texans to mean "simply". In the case of my video, when I said "Just close the window", a more complete, alternate statement would be "To terminate the debugging session, simply close the window."

Of course, and FWIW I absolutely agree that 'simply' works the same way as 'just'. We say 'simply close the window' rather than 'close the window' when we are vaguely aware that there may be complexities, but for the moment we're going to skip over them. Nothing psychoanalytic there – just the semi-conscious pragmatics of daily life.

(But I always pause when I hear myself say something like 'just' or 'simply', and ask myself what I'm trying not to think about :slight_smile: )

Perhaps that is how you think, but it is not how I and many others I talk to think.
"Simply close the window" means "it is very easy to accomplish this by closing the window". There are no expectations of any problems, vague or otherwise.

You're turning something very simple into something very complex by overthinking it.

I hope we have exhausted this largely irrelevant off-topic, as I'm sure everyone else is bored to tears by now. :smile:

After some more testing, closing the Safari Debugger window to terminate the session seems to work very well.

Back in Script Editor, make any change, compile, and run.
The Safari Debugger opens up fine. the key is doing a compile before running again.

Yep. Exactly how I do it. (Except I go back to Atom instead of Script Editor.)

If I want to run all the way through the script, then I do. Otherwise I simply, uh, just, uh… then I close the friggin’ window and I don’t care if it’s right or wrong. There. How’s that?

Since I already had most of the elements for this, I decided to put it all together in an Evernote Public Note, as much for myself as anyone. This is another one of those things that is reasonably easy to do/use, once you know how. The learning how part can be a bit tricky. So I hope this guide will help some.

Evernote Public Note
###[JXA] Debugging JXA Scripts with Safari Debugger
~~~ VER: 1.0 2016-06-20 ~~~

All constructive criticism is very welcome, including comments, error reports, suggestions for improvements.

Everybody can view this web page. Those with Evernote accounts can pull it into their account, although doing so means you have a separate copy, that will not update when/if I publish any updates.