First, make sure you have followed instructions in the Macro Setup below.
See the below "How to Use" Comment Action
This macro is just an example written in response to your request. You will need to use as an example and/or change to meet your workflow automation needs.
MACRO SETUP
Carefully review the Release Notes and the Macro Actions
Make sure you understand what the Macro will do.
You are responsible for running the Macro, not me. ??
. Make These Changes to this Macro
Assign a Trigger to this Macro .
Move this macro to a Macro Group that is only Active when you need this Macro.
ENABLE this Macro, and the Macro Group it is in.
For more info, see KM Wiki article on Macro Activation
.
REVIEW/CHANGE THE FOLLOWING MACRO ACTIONS:
(all shown in the magenta color)
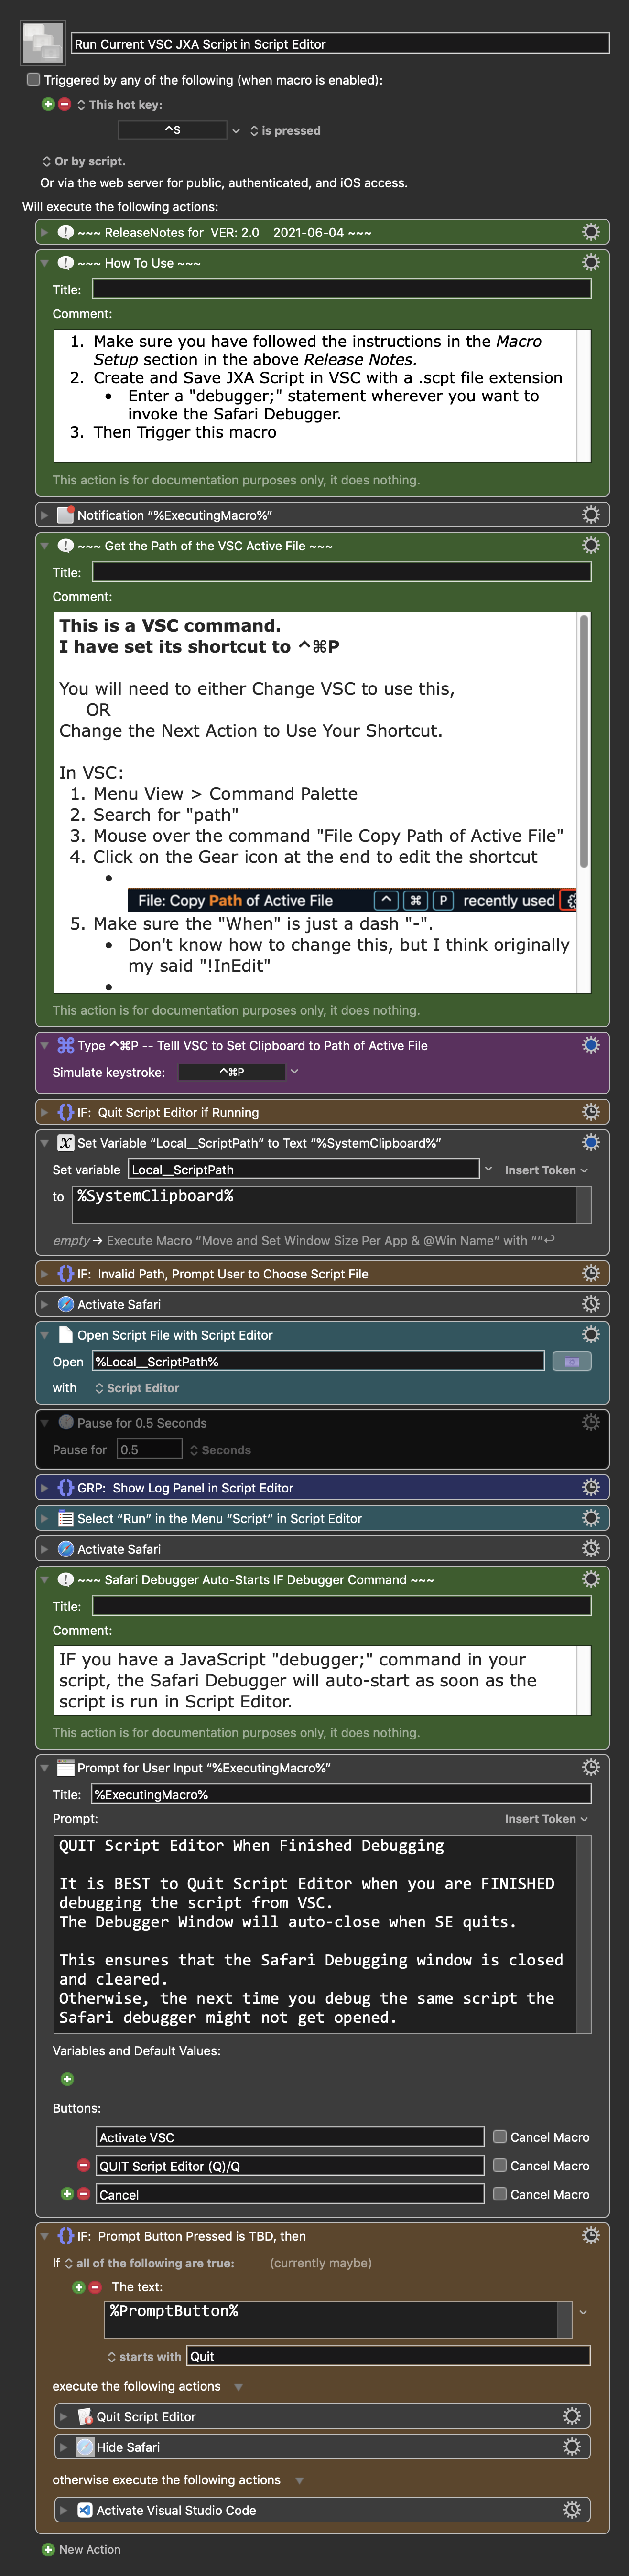
Type ⌃⌘P -- Telll VSC to Set Clipboard to Path of Active File
The Safari JS debugger launches when you run code in VSC (with the Code Runner extension for example), as long you you have Safari set up properly.
(FWIW I never use Script Editor. Apart from the limited memory allocation, its stringification post-processor gives a confused version of the value that is actually returned to a KM Execute JXA action, whereas you can see that value directly and exactly with the output from Code Runner)
Apple has often stated that, and I have it also stated my many experienced JXA scripting developers.
I've never seen it, nor have I seen any detailed instructions on how to setup VSC to do this. Perhaps you could provide:
A short video demo showing this process
Detailed instructions on how to setup VSC and Safari to enable this process.
EDIT 2021-06-04 17:48 GMT-5
There are currently 392 OPEN issues, and over 300 closed issues on the Code Runner GitHub site. It does not sound like a very reliable VSC extension to me.
The context that launches the JS Context can just as well be VSC or TaskPaper as anything else, provided that the inter-app automation permissions are given.
I wonder if the latter have contributed some confusion ?
With Code Runner installed in the normal way, a Run Code command appears in the VSC command palette. The default keystroke is ⌘⌥N I think, (see the extension settings), but I personally have it assigned to something else.
(Code Runner has always worked very well for me – with 7.5M downloads and 4.5 stars, it might be disappointing not to see a bit of repository chatter. Script Editor, in contrast, flakes out a bit more easily – a much more limited memory allocation for JS, and not much evidence of maintenance in recent years. )
PS, it might be worth simplifying your first tests by launching scripts directly at the terminal prompt.
This, at the Terminal.app prompt, for example, also launches the Safari Web Inspector, as long as Terminal has the automations permissions, Safari has the Developer settings, and the script contains a debugger; line in reachable code:
I have independently verified this, and posted a new video showing it.
I didn't discover your new posts until I updated mine.
So, we are in agreement: we really don't need to use Script Editor to debug JXA with Safari.
My understanding now is that originally, when JXA was first released, Script Editor was required. But later (I don't know when) Apple make some updates to allow it to work with osascript. So now many third party tools can directly invoke the Safari JXA Debugger❗
So the world now has my YouTube to show this. I hope others will find it useful.
I have done extensive searching, and previously I did NOT find any Videos or articles on the 'net that indicated how to debug JXA from VSC directly using the Safari Debugger.

 Using Safari")