How to Generate a Memory Leak in the Keyboard Maestro Engine

An Activity Monitor only records what the application is doing over the ten seconds it samples. It does not record anything related to memory use. So unless it is spending a significant amount of time on whatever is causing the memory leak it is unlikely to be helpful.

It is great for any case of the application locking up, freezing, or being slow.

So, to make a short intermediate resume:

By just “using” KM Editor in safe mode for a couple of hours the engine stays at around 500MB, with some minor “spikes” up to 830MB. You are unable to bring it up to several GB, as you can do it in normal mode.

Is this correct?

I assume you have also tried the “repeatedly enable/disable groups” test in safe mode?

Everything you wrote is correct. I intend to keep using Safe Mode for a while. Peter asked me to create a new login ID and start fresh that way. I just created a new login ID and I logged into it in Safe Mode (which I correctly verified). I did connect to my iCloud account when I logged in. When I started KM I didn't see any of my KM macros in the KM Editor. That's okay, I guess. I always enjoy writing new stuff in KM. This copy of KM is pointing to a new user folder which means it's a rather clean setup. Let's see what happens now. I'm about to start creating some macros.

Yes, being in safe mode and in a fresh user account is probably the most clean setup you can get :wink:

I intend to keep using Safe Mode for a while.

Just to make it clear: Safe mode is not intended to be a working environment! In safe mode the performance of your computer is reduced, it runs on the bare minimum. See the “Some features aren't available in safe mode” section in Apple’s article.

Safe mode is a debugging mode, to test for issues with a minimum of potential disturbances by other things, like login items, background processes, kernel extensions, etc.

So, if you find out that your KM Engine runs better in safe mode, the solution is not to work in safe mode every day!

(Though, for the moment it is a good thing that you are apparently testing the issue very thoroughly in safe mode :wink: )


I don’t know if you have seen my PS edit from here:

Have you already tried out if the issue is still present in normal mode now?

(I’m asking because a safe boot also clears many caches, which can also be a factor.)

This is worth a try, even if it’s unlikely that your issue is a caches issue (since it persists across OS updates).

It sounds like any time the macros are changed, the engine memory usage is growing in size.

It may be that there is a specific trigger or action that is leaking memory when it is loaded (or replaced). That's why having your Keyboard Maestro Macros.plist might be the key to figuring it out. You can remove anything you want from it first, just so long as it continues to exhibit the behaviour.

That is a very reasonable theory. Since I followed your advice to create a new macOS account, I don't currently have access to my old macros. And right now the Engine has been stable as a rock at 25 MB, even though I wrote a very complex macro as you may have noticed that I just uploaded. Stable as the rock of Gibraltar. I'm tempted to use this account and only import to it the macros that I really need. It's almost time that I consider leaving Safe Mode and seeing if this new account will work well in Normal Mode. Here in safe mode I have no access to sound or mics (even the keyboard has to be wired and it's not acting reliably in Safe Mode) which limits what I can do with my Mac.

The clean KM account uses only 25 MB for the Engine when I was logged in to Safe Mode. Now I just rebooted to Normal Mode and it's 107MB (fluctuating occasionally as high as 150 MB). This is on my new clean account with only one macro in it. Does that seem right? Jumping from 25 to 107 for no reason? I don't know what's normal but it doesn't feel right. I will continue editing macros here to see what happens.

When I click in the Editor window it jumped immediately to 160 MB then bounced around 106 to 150 for a while. I just inserted 5 empty Switch statements with 10 empty clauses, and the RAM jumped to 250 MB, settling down to 175 MB. Making copies of that macro didn't seem to increase the RAM usage.

Does it seem wrong that five nearly empty macros should take 250 MB ram? I think I need to go back to the Safe Mode now and see if it's still 25MB or 250 MB. Be back in an hour, cause that's how long it takes to boot into Safe Mode.

Okay I'm back in Safe Mode, it took only 25 minutes to reboot. The memory usage for the Engine started off at 170MB (which is odd since it was at 25MB when I was last in Safe Mode an hour ago), then it quickly dropped down to about 70MB in about 30 seconds. Why would the Engine in Safe Mode require 2-3 times less memory than Normal Mode for the same macros (and 3x what it required an hour ago)? So I created about 7 macros with about 7 empty Switch actions in each, and the Engine jumped to 400 MB. Really, 400 MB for 7 macros with nothing but some empty Switch statements? After deleting 6 of the 7 macros the memory has dropped to 225 MB. But remember, its as 70 MB a few minutes ago for the exact same set of macros. Why didn't it go back down to 70? Let me create another 7 empty macros and see what happens: ... okay it didn't shoot back up to 400 MB it stayed at 225 MB. I guess that's good? Let me create a new folder with 7 macros in it with a few empty statements in them: ... okay so with an extra 7 macros the memory requirement has dropped from 225 MB to 176 MB. That's odd. And it's steady there. Why would doubling the number of macros and folders cause the Engine to drop its RAM by 25%? Okay let me double everything I currently have (up to about 24 macros): ... okay now it's dropped again to 121 MB and holding steady. Okay let me double everything again (to 50 macros) and see if I can get another drop: now it's at 144 MB. Let me delete all the macros except for one and see what happens: it's at 125MB now whereas an hour ago it was at 25 MB with this exact same single macro. One macro - five times the RAM required. Considering that most of that 25 MB was probably overhead, it's more like 10x or 100x the RAM for the same single macro!

I have a theory. By using Normal Mode once I have made the KM Engine under Safe Mode change its behaviour. It's now no longer taking a rock solid 25 MB and for the exact same macro an hour ago is taking 100 MB more memory. I'm not experienced enough with macOS modes to know why that would happen. But the Safe Mode KM seems to have been tainted. Does that suggest it's corruption in the KM files which store variable and macros? I'm probably not smart enough to speculate here but I raise that for consideration.

Should I create a new account and see if that same macro goes back down to 25 MB? And then switch to and from Normal Mode to see if the memory requirement quintuples again?

The only macro I have is the Water Glass macro that I uploaded a couple of hours ago. There's hardly anything in there. Just a few math calculations and a loop. Why should that single macro's memory requirement in Safe Mode jump from 25 MB to 125 MB just by changing modes?

I've deleted all my macros, folders and variables and the KM Engine running in Safe Mode on a new account now stabilizes at 162 MB instead of 25 MB even though it's an empty set of macros. I probably don't need to reiterate this but I'm guessing that the KM data files (I better not call them "Peter's Files", in case he's seen that episode of The IT Crowd) saved under Normal Mode are corrupt and that corruption is now passed to Safe Mode.

Thanks for all the great support, everyone, especially Peter. If it's a choice between new features in KM 9.0 or getting this fixed, I'd pick the former. :slight_smile:

Safe Mode is a wonky mode, not something to run in normally. Boot in to Safe Mode, which clears out caches and such and does not load everything, resolve whatever emergency problem you have, and then boot in to normal mode. Don't stay in Safe Mode, that is not a good idea.

The files are not corrupted, not by Safe Mode or Normal Mode.

Some growth is expected for almost anything you do the first time. Keyboard Maestro lazily loads lots of stuff, so the first time you add a Switch statement, it will load things like icons and such. All sorts of things. Also, the engine size will not be stable initially after launch. The engine will be caching things like applications and application icons and all sorts of stuff that in preflights and loads slowly so that a) it wont immediately impact the engine at launch, but b) will probably be loaded and cached before you actually need it.

So. Boot in to Normal Mode. Use either account, it wont matter. If you want to start afresh, just export whatever macros you want to preserve, and any named clipboard or variables whose values you need to save, and then quit Keyboard Maestro and Keyboard Maestro Engine, trash your ~/Library/Application Support/Keyboard Maestro folder and launch Keyboard Maestro, set up any macros as needed.

Then in the editor, after you have been using Keyboard Maestro and Keyboard Maestro Engine for a while, check the memory usage and try toggling a macro on and off a few times and see if there is any memory growth.

Sorry, I was away for a couple of days.

Did you find out the source of that corruption? (Most likely this is your problem.)


Another thing that can help – not only in this case –, is running a little diagnosis.

Download the free version of EtreCheck and run it (choose “No problem – just checking”). When finished review the results; check the warnings that are displayed and look out for anything unusual.

If you want you can upload the report here, or in a PM to me.

There are two ways to do that:

  • Complete report: Go to File > Save and upload the saved file.
  • If you think the report may contain sensitive information, then just copy the text:
    1. Click the Share Report button in the toolbar and select Copy Report.
    2. Paste it into TextEdit.
    3. Remove any sensitive information from the text. Place a note where you have removed something, so I know that the section is not complete.
    4. Save the text file and upload it.

EtreCheck does not provide very in-deep diagnostics, but it gives a good overall-view of what is going on on the user’s box. And this is very important. (Heck, I’ve seen setups with three different anti-virus programs running in the background, and the guy wasn’t aware.)

PS:

I just noticed that I asked you a couple of times if your “disable/enable groups” method still triggers the memory spike in Normal mode now (after having been in Save mode).

Any info on that? (Sorry, if I missed the passage in your texts.)

Thanks for your concern. Part of the reason it's hard to make progress is that it takes exactly 20 minutes to boot to Safe Mode. Another part is that under the advice of Peter the testing in Safe Mode is done under a new macOS account, which is a clean account. It was done that way on purpose so I wouldn't have 800 macros in my KM.

The first time I did this, for my new account in Safe Mode, the Engine took 25 MB. Then when I tried that same account under Normal Mode it was quite a bit more then when I switched back to Safe Mode I think I reported 140 MB for the Engine which didn't make sense because it was a fresh copy of KM on a fresh MacOS account with no macros at all.

However today I rebooted into Safe Mode on my new account, which is still clean and fresh like a Downy towel, and I'm at 21 MB which is good and healthy.

At one point I said I may do a binary search of enabling/disabling all my macro groups in my normal macOS account to find the corrupt macro, if any, but I haven't done that yet. I think that's what you want me to do.

I guess I can run EtreCheck if you recommend it, which you are doing (I'm only 90% paranoid.) I presume you want me to do that from my normal account, not my clean account. I'll tell you what. I'll download it onto my clean account now, run it, and see if I'm willing to run that on my normal account. I think you're primarily interested in the data from my normal account, but it sure couldn't hurt to have a clean baseline for comparison. So I'll start with that now.

I generated some EtreCheck results and wanted to take you up on your offer to PM you the results. But when I tried to do that it appeared to post my Mac's results right here in the public forum. I think that's a bit too public for me. So let me do some research to see if I can figure out how to PM you.

Back on my regular macOS account where all this memory leak started, I'm still getting a leak in the Engine. The amount is exactly 24 MB per minute of clicking on macro group checkboxes. After about 30 minutes I was around 600 MB. It was always going up, never down at all.

After the first five minutes I realized manual clicking was ridiculous and so I made a macro on my Rival 500 mouse to repeatedly click wherever my mouse pointer was.

Okay I've gone through another major cleanup, exporting all but 257 of my macros. (I think I was around 800 earlier this evening.) Now I'm down to 9 MB per minute lost.

Think about that. I've removed exactly two thirds of my macros, and my accumulating memory loss has dropped by exactly two thirds. This suggests it's not one of my macros per se, but exactly linearly proportional to the number of macros.

Why don't we just have me start afresh? I could delete (ie, export) all my macros, delete KM, re-install KM, and re-install macros as needed? Does anyone object to that?

You did it right, I think. I see a deleted post in my private forum mailbox, and before I received the text as mail. Anyway, you have to click my avatar and select “Message” there.

But better upload the zipped report, instead of copy/pasting the text. (Just drag the zip file into the editor window of the private post.)

And please run EtreCheck with administer privileges, otherwise many infos are missing.

Because we noticed that your issue persists across different hardware. So, you did already a fresh KM install in the past. In addition, you said that you use to re-write the macros on new machines.

But, of course, try it again. If you export/import the macros, it’s a thing of 5 minutes.

But don’t forget to wipe KM completely, that is, have a thorough look through your ~/Library, especially Application Support and delete everything related there. Also the preferences plist in ~/Library/Preferences. (Back up the files before to some other place.)

Once again, sorry for the delay. And, in addition, it seems that I missed some points in your posts when I read them the last time.

So, one thing after the other:

Part of the reason it's hard to make progress is that it takes exactly 20 minutes to boot to Safe Mode.

As mentioned by me and also by @peternlewis, safe mode is not a thing to live in. You’ve already done some tests in safe mode, and the confirmed conclusions were:

[@Tom:] So, to make a short intermediate resume:

By just “using” KM Editor in safe mode for a couple of hours the engine stays at around 500MB, with some minor “spikes” up to 830MB. You are unable to bring it up to several GB, as you can do it in normal mode.

Is this correct?

I assume you have also tried the “repeatedly enable/disable groups” test in safe mode?

You confirmed this in your follow-up:

Everything you wrote is correct.

I know, at that time you haven’t spent much time in safe mode, I think, 20 minutes you said. But I skimmed thru your later posts and I couldn’t find any mention that you succeeded to reproduce a memory leak of 1GB or more with subsequent safe mode tests. (Correct me, if I missed something.)

So, we have already a pretty heavy clue here: The issue doesn’t seem to be a KM-“standalone” issue. (Otherwise it – likely – would have appeared in safe mode, too.)

Your results in a vanilla user account seem to be similar, with or without safe mode.

So, the pretty logical conclusion was: there is one or more third-party players in the game.
[this part is in bold, because it is a very crucial assumption, based on your results, as I interpret them.
If this is wrong, you have to tell me.]

That’s why I asked you to run the EtreCheck diagnostics. To get a rough overview of what is going on on your computer.

[you:] I presume you want me to do that from my normal account, not my clean account.

Yes, because with the problem (> 1GB issue) not being present in a vanilla account and/or in safe mode, it wouldn’t make sense to run the diagnostics there.

And, if you are still willing/motivated to track down the problem, it would be helpful to run the diagnostics as admin. Otherwise, lots of infos will be missing.

(As said, in case of privacy concerns, upload the zipped result as a PM to me and/or redact the sensitive parts before; leaving a note in the text where you have removed something.)

– Tom

I am very appreciative that you are trying to help. Sometimes it's best not to do too many things at once because then you don't know what fixed it. In the last few days I've removed ALL my global variables, and clipboards, and most of my macros. I don't think any of my remaining macros are triggered by anything I'm doing (except I'm always working on one new macro.) AND YET the problem is still HUGE. Within a minute of my last login my KM Engine memory flies up (as I start to run a macro I wrote yesterday) from a small starting value of about 40 MB up to over 1 GB. Then it fluctuates wildly and maybe settles around 200 MB but refuses to respond to anything including clicking on the engine icon up in the system try in the upper right corner of the OS. The Engine is dead. I wait a few minutes and there's no response so I force kill it. I probably had to kill the Engine about 5 times today. I tend to notice it when it reaches about 1 GB and becomes sluggish.

When you say there's a third party player it seems that you think something else running on my system is somehow causing the Engine to leak. It's possible.

Today I spent most of my day writing a KM macro that lets me edit/filter my global variables, and even my text clipboards and to a degree, some text files. I haven't fully debugged it, but what I've tested works great, and I was going to upload it when it's all done. I don't see how it would help to upload this macro right now. I can't see how a basic macro that processes small text files with filters could possible cause 1 GB Engine memory leaks.

So I think what I'm going to do now is reinstall KM. You gave me some tips above to make it a clean install. After that I'm thinking of using my clean new macOS user account to do all my KM development. If it still doesn't work then, we can consider EtreCheck.

Yes, to find this out was the main point of doing the safe-mode experiment. And according to your reports it seems that this is indeed the case.

If this is true, then it is probably not very efficient if you continue to search for the cause inside KM (variables etc.).

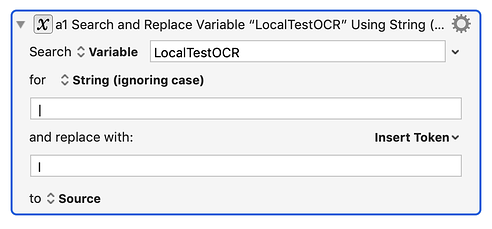
I have found what might be an important clue. I decided to open the debugger and see what actions were running when the leak was occurring. Not sure why I didn't think of this before. It turns out that there's only one type of action that is running when the Engine hangs up for minutes at a time (and the memory leak tends to occur during these freezes). That is the Search and Replace Variable action. I use these actions from time to time in various macros. Usually they work 100% fine. But sometimes they freeze the Engine for 1-10 minutes. Here's the one it's frozen on right now for over 5 minutes:

In English, that action replaces "a space followed by a vertical bar" with "a space followed by a lowercase l". Is there something about that particular action that is the direct cause of my Engine hangups and memory leaks? It's not even a Regex search!!!!

The reason that the name of the action starts with "a1" is so that I can see in the debugger which Search and Replace action is hanging the Engine.

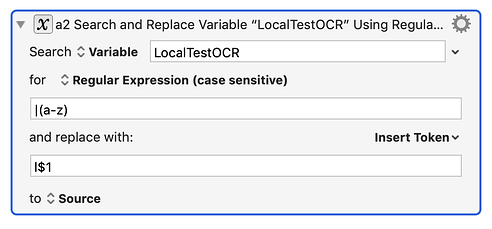
Okay while I typed that the Engine has completed that action and has moved to the next action which is:

This image replaces "space letter" with "letter-l letter". And it looks like the Engine is going to hang on that one for five minutes also. This one IS a Regex search.

If it was something unrelated to KM that was causing this leak, wouldn't you think that I would occasionally see other actions besides that one where the Engine freezes on? I don't use Search and Replace very much but it's the only action that the Engine freezes on.

I might wait for your thoughts here before I reinstall KM. Because this might be a big clue.