Draw & display a graph?

One simple way of having KBM display a "dashboard" kind of chart I found is to...

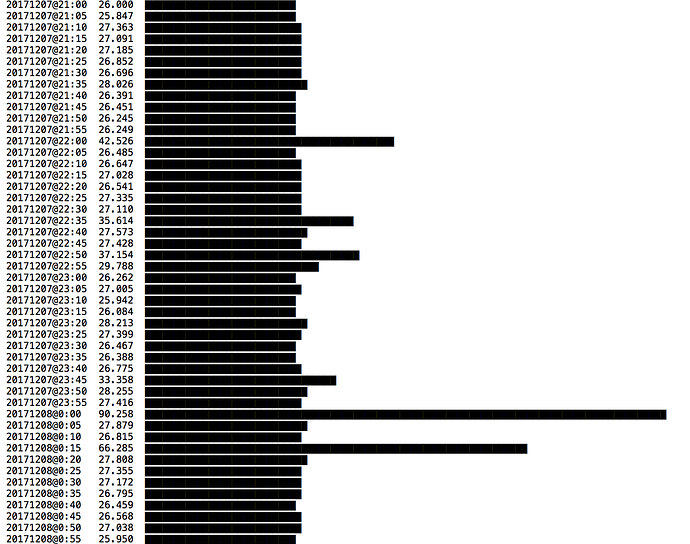
  1. turn numbers into a string of █ characters (i.e. a value of 5 becomes █████, etc.)
  2. on each run, append a text file with the current value on a new line
  3. on each run, display the text file's contents in a "Display Text" window, and close the previous one

This gives me a simple "dashboard" style graph for single values.

This is an example, where ping response times are "graphed" over time by KBM in a text file:

But can one do more complex graphs with KBM?

Example:

I buy Facebook ads. Every 5 minutes, I have KBM grab my current stats from Facebook - amount spent so far, number of impressions, number of clicks, etc..

Then, I have KBM compute the cost per click for the last interval:

(current "spent" value minus previous "spent" value)
divided by
(current "clicks" value minus previous "clicks" value)

I'd now like KBM to draw several graphs for me, which are always kept up to date.

For instance, a cumulative record of how many clicks my ad got over time (x axis would be "minutes since first entry", y axis would be "clicks"). Such a graph would look like this:
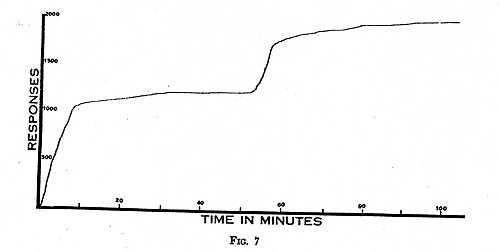
For my purposes, it would be enough if KBM only drew the axes and placed a dot for each new value. I don't need an actual curve drawn through the data points.

Or, for the cost-per-click value, I'd like a graph that displays this value over time (x-axis: minutes since first data point; y-axis: cost per click during last interval). This chart would look similar to this:

The axes should automatically adapt, so that the dataset is always displayed fully on the available screen space of the chart. And the labels on the axes should also intelligently update, so that they remain readable.

What would be the easiest and simplest way to accomplish this?

I know that I could have KBM enter the data into an Excel Spreadsheet or a Google Sheet, and have the graphs created there. But I would prefer not having to deal with some external application.

I imagine that there might be, perhaps, some kind of JavaScript library for turning data into beautiful graphs. And that, using it, all the coding required in KBM would be to...

  • invoke that library,
  • tell it what kind of graph I want,
  • tell it what data to use for x and y
  • and then tell it where to display the graph.

Any ideas how this could be accomplished? Thanks.
If you:

  1. Get your data, in JSON (or CSV or TSV) format, into a KM variable, and
  2. use a KM Custom Floating HTML Prompt action

then you can:

  1. Choose some D3JS code for a graph type that you like (plenty of examples like this at http://bl.ocks.org/ )
  2. include, in the prompt action HTML:
    • <script src="https://d3js.org/d3.v4.min.js"></script>
      • (or alternatively make a local copy of the d3 js file, and use a reference of the form <script> ... </script> where the ellipsis between opening and closing script tags is replaced by the minified js source code from https://d3js.org/)
    • A line to read and JSON.parse the data in the KMVAR, like: var data = JSON.parse(window.KeyboardMaestro.GetVariable("jsonData"));
    • The D3JS source for your preferred graph type
  3. Run the prompt action

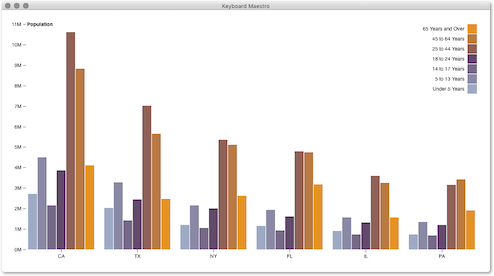
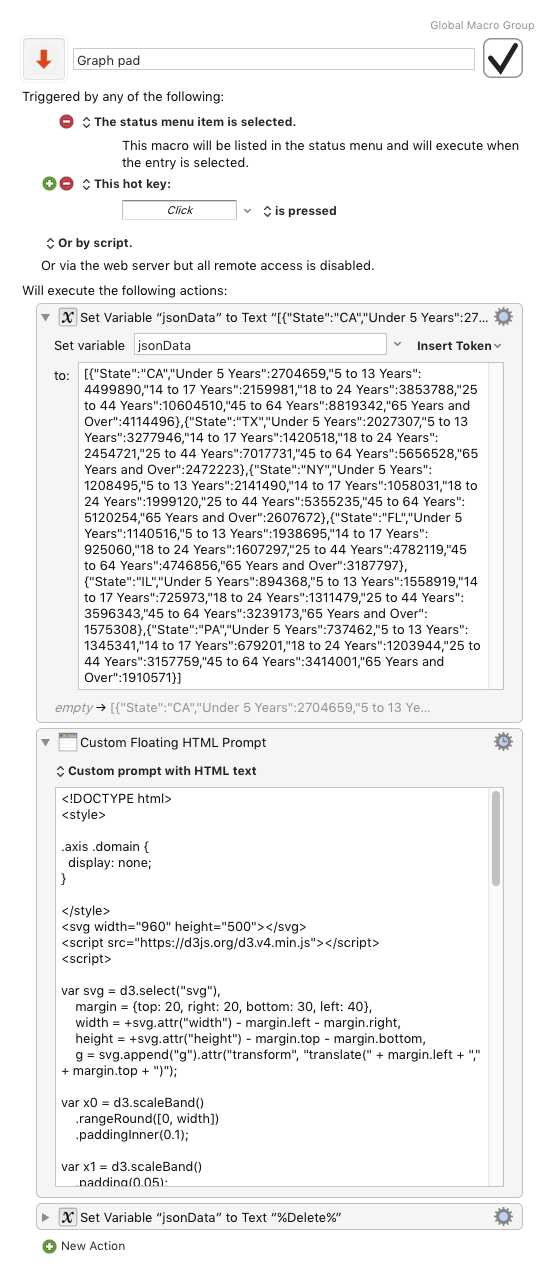
Here is a basic macro derived from a StackOverflow example

Graph pad.kmmacros (22.3 KB)

3 Likes

Nice. But I don’t see how to get the graph out into a file e.g. PNG.

Serialization of HTML Canvas graphics would involve invoking an additional library, I think. See, for example:

(Though you could also directly copy the generated svg through the Right-Click Inspector function, paste it into a text file, and load it with an SVG-capable graphics editor)

More generally, see under SVG to PNG

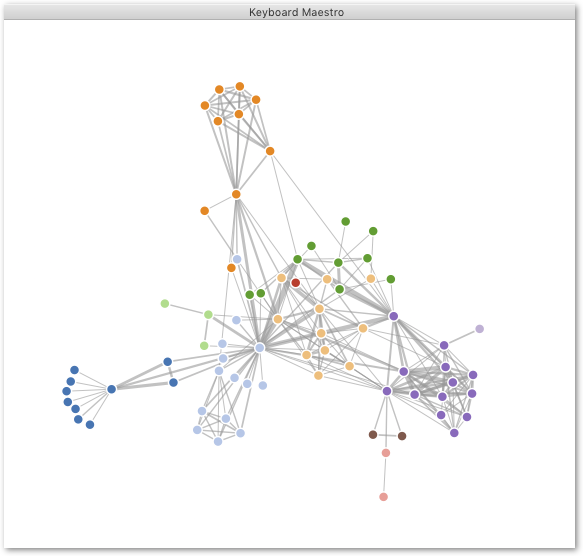
Another example, showing how to adapt D3JS examples like:

(Released under the GNU General Public License, version 3.)

(which typically load their data from a server)

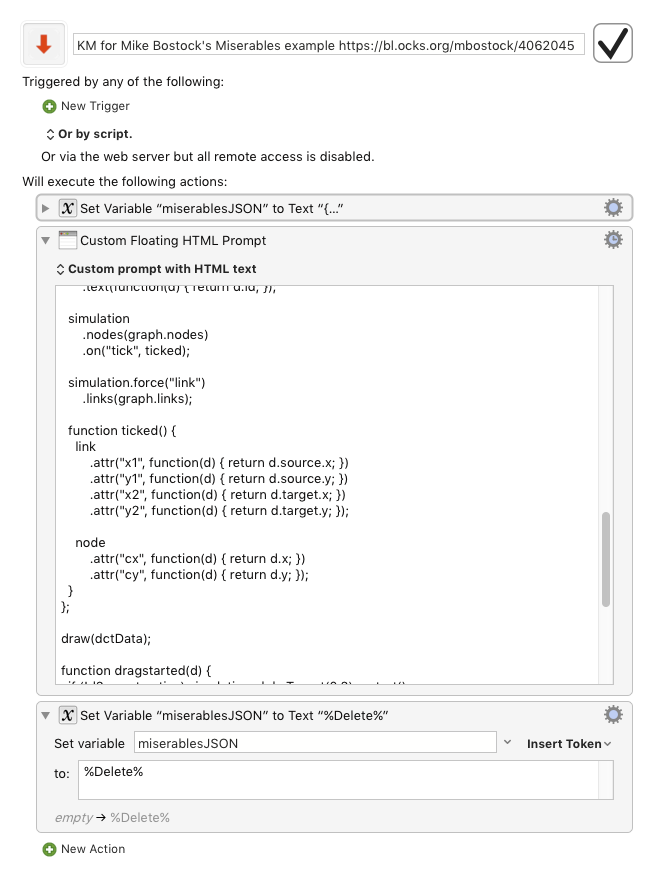
to the requirements of a KM macro which gets its data from a KM variable.

Three steps:

  1. Remove any d3.json() (or d3.csv() / d3.tsv()) wrapping from the central function,
  2. rewrap the code as a local function on existing local data, (dropping the error argument), and
  3. call that local function.

KM for Mike Bostock's Miserables example https:bl.ocks.org:mbostock:4062045.kmmacros (38.8 KB)

Or an alternative version in which the whole (200+kb) minified JS of the D3JS source is included within the source of the HTML prompt action, rather than downloaded over the network at run-time:

Ver B - KM for Mike Bostock's Miserables example https:bl.ocks.org:mbostock:4062045 copy.kmmacros (264.2 KB)

Original d3.json() call:

d3.json("miserables.json", function (error, graph) {
    if (error) throw error;

    var link = svg.append("g")
        .attr("class", "links")
        .selectAll("line")
        .data(graph.links)
        .enter()
        .append("line")
        .attr("stroke-width", function (d) {
            return Math.sqrt(d.value);
        });

    var node = svg.append("g")
        .attr("class", "nodes")
        .selectAll("circle")
        .data(graph.nodes)
        .enter()
        .append("circle")
        .attr("r", 5)
        .attr("fill", function (d) {
            return color(d.group);
        })
        .call(d3.drag()
            .on("start", dragstarted)
            .on("drag", dragged)
            .on("end", dragended));

    node.append("title")
        .text(function (d) {
            return d.id;
        });

    simulation
        .nodes(graph.nodes)
        .on("tick", ticked);

    simulation.force("link")
        .links(graph.links);

    function ticked() {
        link
            .attr("x1", function (d) {
                return d.source.x;
            })
            .attr("y1", function (d) {
                return d.source.y;
            })
            .attr("x2", function (d) {
                return d.target.x;
            })
            .attr("y2", function (d) {
                return d.target.y;
            });

        node
            .attr("cx", function (d) {
                return d.x;
            })
            .attr("cy", function (d) {
                return d.y;
            });
    }
});

Rewrapped and called as simple function on local data.

var dctData = JSON.parse(
    window.KeyboardMaestro.GetVariable("miserablesJSON")
);

function draw(graph) {

    var link = svg.append("g")
        .attr("class", "links")
        .selectAll("line")
        .data(graph.links)
        .enter()
        .append("line")
        .attr("stroke-width", function (d) {
            return Math.sqrt(d.value);
        });

    var node = svg.append("g")
        .attr("class", "nodes")
        .selectAll("circle")
        .data(graph.nodes)
        .enter()
        .append("circle")
        .attr("r", 5)
        .attr("fill", function (d) {
            return color(d.group);
        })
        .call(d3.drag()
            .on("start", dragstarted)
            .on("drag", dragged)
            .on("end", dragended));

    node.append("title")
        .text(function (d) {
            return d.id;
        });

    simulation
        .nodes(graph.nodes)
        .on("tick", ticked);

    simulation.force("link")
        .links(graph.links);

    function ticked() {
        link
            .attr("x1", function (d) {
                return d.source.x;
            })
            .attr("y1", function (d) {
                return d.source.y;
            })
            .attr("x2", function (d) {
                return d.target.x;
            })
            .attr("y2", function (d) {
                return d.target.y;
            });

        node
            .attr("cx", function (d) {
                return d.x;
            })
            .attr("cy", function (d) {
                return d.y;
            });
    }
};

draw(dctData);
1 Like

Right click just offered a single “Reload” option. Clicking on that produced a blank HTML prompt. I could debug that, but that isn’t the point.

Ah, Peter would know, but I wonder if that difference between our systems expresses our default browser settings ? (Mine is Chrome).

Otherwise, I think the best route will be to use Peter’s controls to enable some use of one of the SVG to PNG libraries, as in the Nikita Rokotyan example above.

Possibly “user error” :slight_smile: on my part as I tested from within the Keyboard Maestro editor.
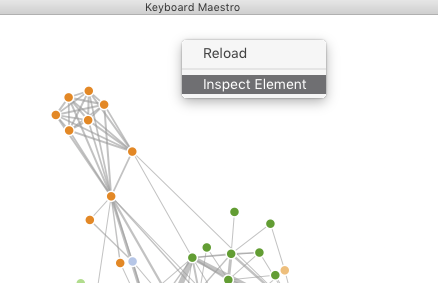
Any luck with the displaying HTML prompt action ?

I'm getting this:

No. But to repeat, it might be a function of testing from within the Keyboard Maestro editor - clicking the tick button.

I'm testing from within the KM editor, clicking the 'Run the selected macro' button in the KM toolbar

(macOS 10.12.6)

Not on 8.0.4 on 10.13.2. :frowning:

I haven't tried this, but it looks like it might be a route:

defaults write com.stairways.keyboardmaestro.engine WebKitDeveloperExtras TRUE

https://wiki.keyboardmaestro.com/action/Custom_HTML_Prompt

Thanks @ComplexPoint. That made the second context menu item show up.

It didn’t get me a whole lot further, though: None of the 3 browsers I tried - Safari, Firefox, and Chrome - let you save the picture as an image. (Which would be my use case.)

Display is one thing; Using in slides quite another.

That’s right, from the browser you would need to manually copy the SVG, and then convert it externally to PNG or PDF

There seem to be various options, once we have captured SVG to a KMVAR or local JS var, including:

http://cairosvg.org/

and

(plus, re Webkit, the footnote pointer to https://stackoverflow.com/questions/21049179/drawing-an-svg-containing-html-in-a-canvas-with-safari/21095912#21095912 )

I’ll take a look when I get a moment.

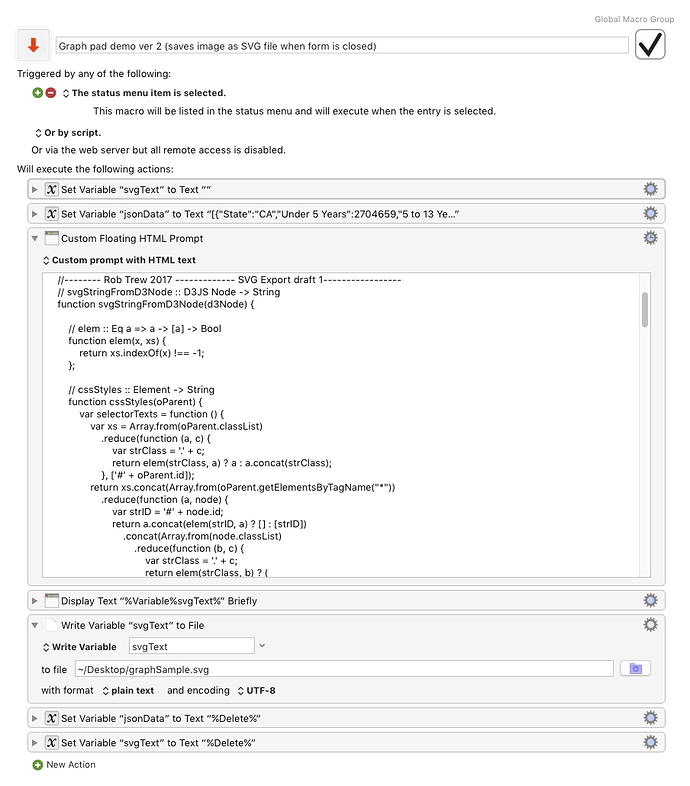
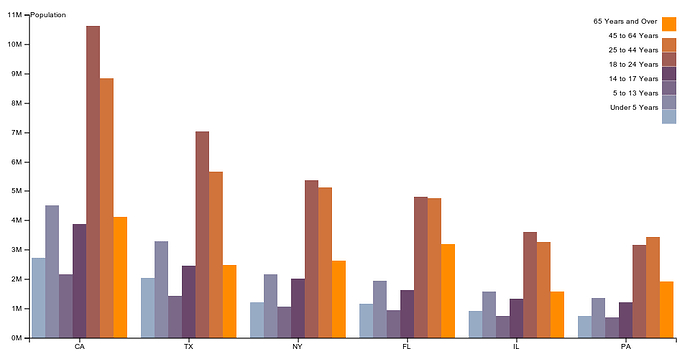
Some progress, at least as far as saving an .SVG file – in this updated demo version I have inserted the first draft of an svgStringFromD3Node function (source of an ES5 version below), which can be used to capture SVG, with the CSS styles used, into a KM variable.

When the graph display (KM HTML Prompt action) of this proof-of-concept macro is closed, an SVG file is saved to ~/Desktop/graphSample.svg

You should find, if you open it in Safari:

  • that there is a fairly good match with the original, and that
  • you can from print/export as PDF and then open in Preview (from which saving as PNG is also an option)

Graphic editors seem to vary in how well they import the styles, particularly the details of index text placement (though you can typically 'ungroup' the imported image and adjust it), so I guess the next stage is perhaps to handle the automation of a SVG -> PDF or SVG to PNG etc conversion with some fairly widely available tool. (Though maybe the Safari + Preview combo will prove the best ...)

Working here with Sierra 10.12.6 and Keyboard Maestro 8.0.4

Graph pad demo ver 2 (saves image as SVG file when form is closed).kmmacros (26.9 KB)

Source of first draft of svgStringFromD3Node

    //-------- Rob Trew 2017 draft 0.01 --------------------------------------
    // svgStringFromD3Node :: D3JS Node -> String
    function svgStringFromD3Node(d3Node) {

        // elem :: Eq a => a -> [a] -> Bool
        function elem(x, xs) {
            return xs.indexOf(x) !== -1;
        };

        // cssStyles :: Element -> String
        function cssStyles(oParent) {
            var selectorTexts = function () {
                var xs = Array.from(oParent.classList)
                    .reduce(function (a, c) {
                        var strClass = '.' + c;
                        return elem(strClass, a) ? a : a.concat(strClass);
                    }, ['#' + oParent.id]);
                return xs.concat(Array.from(oParent.getElementsByTagName("*"))
                    .reduce(function (a, node) {
                        var strID = '#' + node.id;
                        return a.concat(elem(strID, a) ? [] : [strID])
                            .concat(Array.from(node.classList)
                                .reduce(function (b, c) {
                                    var strClass = '.' + c;
                                    return elem(strClass, b) ? (
                                        b
                                    ) : b.concat(strClass);
                                }, xs));
                    }, xs));
            }();

            // Relevant CSS rules
            return Array.from(document.styleSheets)
                .reduce(function (a, x) {
                    return a + Array.from(x.cssRules)
                        .reduce(function (b, r) {
                            return elem(r.selectorText, selectorTexts) ? (
                                b + r.cssText
                            ) : b;
                        }, '');
                }, '');
        };

        // MAIN --------------------------------------------------------------
        return (
           // Effect
            d3Node.setAttribute('xlink', 'http://www.w3.org/1999/xlink'),
            d3Node.insertBefore(
                function () {
                    var elemStyle = document.createElement("style");
                    elemStyle.setAttribute("type", "text/css");
                    elemStyle.innerHTML = cssStyles(d3Node);
                    return elemStyle;
                }(),
                d3Node.hasChildNodes() ? (
                    d3Node.children[0]
                ) : null
            ),
           // Value
            new XMLSerializer()
            .serializeToString(d3Node)
            .replace(/(\w+)?:?xlink=/g, 'xmlns:xlink=')
            .replace(/NS\d+:href/g, 'xlink:href')
        );
    };

I like the idea of using a good graphing library to graph in a web page, but then it makes it hard to get it as an image.

However, if you just want the image, you could probably draw the graph yourself using Keyboard Maestro's primitive.

Create New Image.kmactions (755 B)

3 Likes

SVG -> PNG

The ImageMagick convert command seems to be producing PNGs quite effortlessly from the SVG here.

PNG from the SVG of the earlier macro (click on the image itself to enlarge)

There's more on using ImageMagick with Keyboard Maestro in various posts in this thread

3 Likes

Good idea. I just did that and uploaded my code for free use.